Figures & data
Table 1 The Primers Used in This Work
Figure 1 Combined effects of raltitrexed and apatinib on cell proliferation in ESCC cells. (A) Detection of VEGFR2 expression in KYSE30 and TE-1 cells by Western blot. β-ACTIN was detected as loading control. (B and C) Cell proliferation rates of KYSE-30 (B) and TE-1 (C) cells after being treated with control, 50 µM apatinib, 2.5 µM raltitrexed, or 50 µM apatinib + 2.5 µM raltitrexed for the indicated time in MTS assays. Data indicate means+±SD of three biological replicates. Student’s t-test; *P<0.05, **P<0.01 (vs control); #P<0.05, ##P<0.01 (vs 50 µM apatinib).
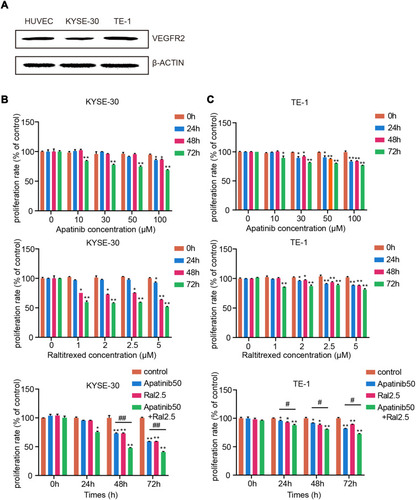
Figure 2 Combined effects of raltitrexed and apatinib on viability of ESCC cells. (A and C) Representative images of colony formation assay after KYSE-30 (A) and TE-1 (C) cells were treated with control, 50 µM apatinib, 2.5 µM raltitrexed, or 50 µM apatinib + 2.5 µM raltitrexed for 14 days. (B and D) Quantification of the colony formation assays in KYSE-30 (B) and TE-1 (D) cells shown in (A and C), respectively. Data indicate means±SD of three biological replicates. Student’s t-test; ***P<0.001 (vs control); ###P<0.001 (vs 50 µM apatinib).
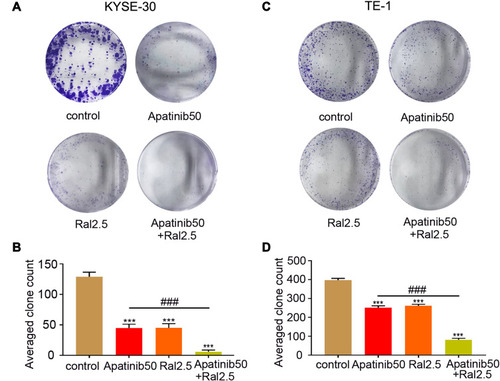
Figure 3 Combined effects of raltitrexed and apatinib on cell invasion in ESCC cells. Transwell analysis of KYSE-30 (A and B) and TE-1 (C and D) cells was performed 24 hours after treatment with control, 50 µM apatinib, 2.5 µM raltitrexed, or 50 µM apatinib + 2.5 µM raltitrexed. Data indicate means±SD of three biological replicates. Student’s t-test; *P<0.05, **P<0.01 (vs control); #P<0.05, ##P<0.01 (vs 50 µM apatinib). Magnification ×100; Scale bar=200 µm.
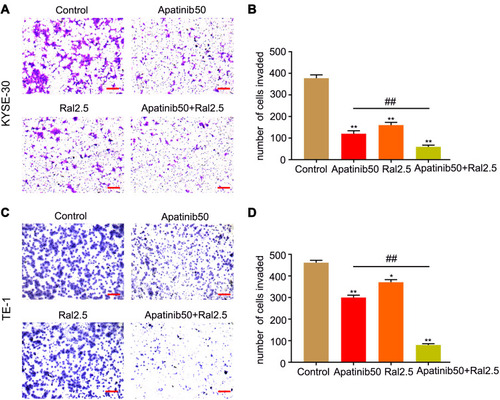
Figure 4 Combined effects of raltitrexed and apatinib on cell apoptosis in ESCC cells. KYSE-30 (A and B) and TE-1 (C and D) cells were exposed to control, 50 µM apatinib, 2.5 µM raltitrexed, or 50 µM apatinib + 2.5 µM raltitrexed for 48 hours before Annexin V-FITC and PI staining and apoptosis percentage was detected by flow cytometry. Data indicate means±SD of three biological replicates. Student’s t-test; *P<0.05, **P<0.01 (vs control); #P<0.05, ##P<0.01 (vs 50 µM apatinib).
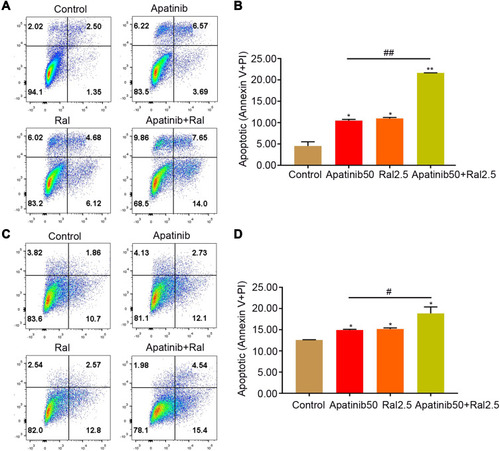
Figure 5 Combined effect of raltitrexed and apatinib on apoptosis-associated gene transcription in ESCC cells. mRNA levels of PARP, Bax, Caspase-3, and Bcl-2 were measured by qPCR in either KYSE-30 (A–D) or TE-1 (E–H) cells after treated by 50 µM apatinib, 2.5 µM raltitrexed, or both. Data indicate means±SD of three biological replicates. Student’s t-test; *P<0.05, **P<0.01 (vs control); #P<0.05, ##P<0.01 (vs 50 µM apatinib).
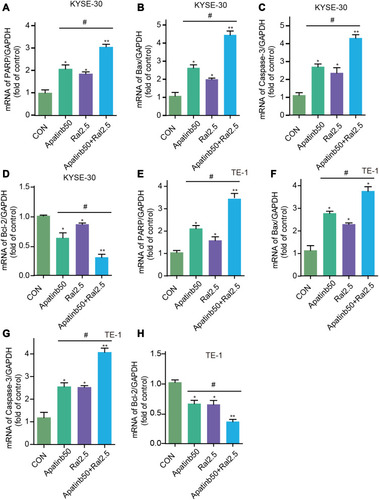
Figure 6 Protein expression after various treatments detected and quantified by Western blot. (A)KYSE-30 cells were treated by 50 µM apatinib, or 2.5 µM raltitrexed, or both for 48 hours before expression of MMP-9, BCL-2, BAX, p-ERK, ERK, p-AKT, AKT, p-VEGFR2, VEGFR2, Caspase-3, Cleaved Caspase-3, and LC3 were examined by Western blot analysis. β-ACTIN was detected as loading control. (B-I) Quantification of different protein expression levels. **P<0.01 (vs control); ##P<0.01 (vs 50 µM apatinib).
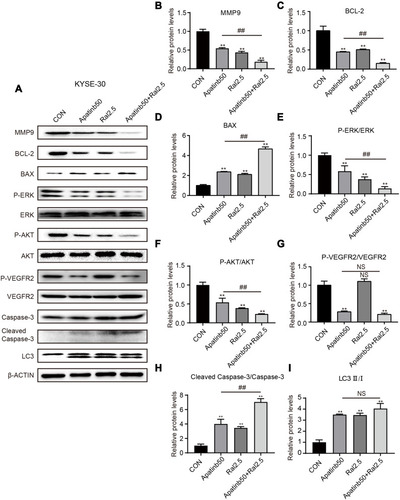
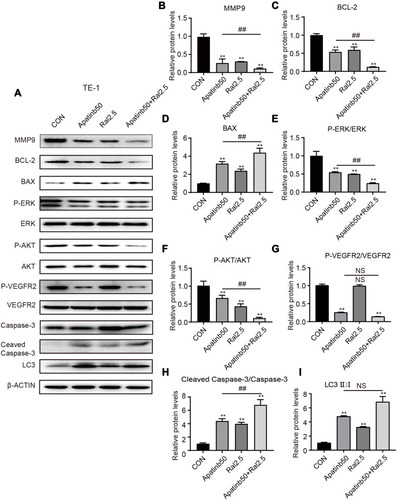
Figure 7 Protein expression after various treatments detected and quantified by Western blot. (A)TE-1 cells were treated by 50 µM apatinib, 2.5 µM raltitrexed, or both for 48 hours before expression of MMP-9, BCL-2, BAX, p-ERK, ERK, p-AKT, AKT, p-VEGFR2, VEGFR2, Caspase-3, Cleaved Caspase-3, and LC3 were examined by Western blot analysis. β-ACTIN was detected as loading control. (B-I) Quantification of different protein expression levels. **P<0.01 (vs control); ##P<0.01 (vs 50 µM apatinib).