
Figures & data
Figure 1 I: Clonal hematopoiesis. (Α) G-banded chromosome preparation. The arrows indicate the rearranged chromosomes. (Β) Detailed view of array analysis for chromosomes 2, 13, and 14, respectively (A–C). Regions with a DNA copy number loss are indicated in red, and intervals with gains are highlighted in blue. Whole-genome profiling by microarray identified multiple genomic imbalances (D). Microarray probes are arranged according to their physical map locations on each chromosome from the distal p-arm (on the left) to the distal q-arm (on the right). Chromosomes are plotted in a horizontal fashion and marked with different colors. An average logarithmic ratio (log2) is displayed for all oligonucleotide probes. Probes with a log2 ratio clustered around zero indicate DNA segments with normal copy numbers. A positive log2 ratio (above zero) indicates a gain (extra copy) of the chromosomal region, while intervals with a negative log2 ratio (below zero) represent loss of DNA copy number. II (A–E) Histopathologic findings of Erdheim-Chester disease. Bone tissue section showing intense fibrohistiocytic infiltrate (A), with prominent proliferation of foamy histiocytes (B). Immunohistochemistry revealed immunopositivity of the infiltrate for CD68 (C) and CD163 (D), but not for S100 (E). (A and B) Hematoxylin and eosin stain, 100x and 200x magnification, respectively; (C–E) immunohistochemistry, 200x magnification. (F) Pyrosequencing assay highlighting the presence of the BRAFV600E mutation in tumor cells (nucleotide substitution 1799T>A, frequency 15% units). III (A–D) Histopathologic findings of acute myeloid leukemia with mutated NPM1. Bone marrow tissue section showing abnormally increased (>98%) cellularity (A). Immunohistochemistry revealed immunopositivity of the blastic infiltrate for myeloperoxidase (B) and NPM1 (C, nuclear and cytoplasmic staining) but not for CD34 (D). ((A): hematoxylin and eosin stain, 100x magnification; (B–D) immunohistochemistry, 400x magnification).
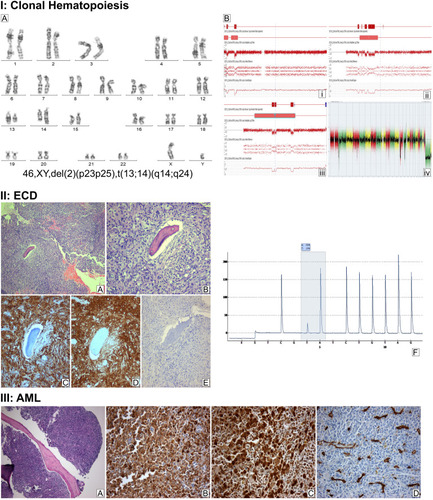
Figure 2 Serial follow-up with Maximum Intensity Projection Whole Body Positron Emission Tomography. (A, B) Initial staging at ECD diagnosis with extensive metabolically active disease; (C, D) progressive metabolically active disease after 1 year treatment with INF-a; (E, F) stable metabolically active disease following induction chemotherapy with two cycles of Ara-C and idarubicin plus midostaurin, and (G, H) metabolic response with significant improvement of the previous PET findings 6 months following the initiation of consolidation therapy with three cycles of HiDAC plus midostaurin following maintenance with midostaurin.
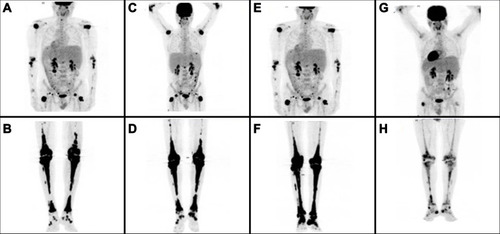
Table 1 Mutated Genes Detected by Targeted Next Generation Sequencing at the Time of AML Diagnosis