Figures & data
Table 1 Top 20 Most Significant Prognostic Genes
Figure 1 (A) Significantly amplified segments in the CC genome. (B) Significantly deleted segments in the CC genome. (C) The top 50 genes with the most significant p values. The upper histogram represents the total number of synonymous and nonsynonymous mutations in the 50 genes from each patient, and the right histogram represents the mutation proportion of 50 genes in all samples. (D) A total of 839 genes with significant copy number variation and mutations were included in the KEGG pathway analysis. (E) A total of 839 genes with significant CNV and mutations were included in the GO biological process analysis. (F) The relationship between prediction error rates and the number of separate trees. (G) The out-of-bag importance rank of the top 6 genes.
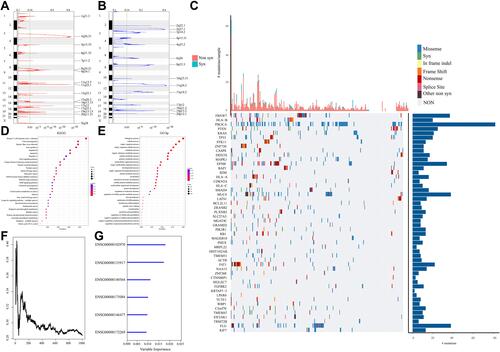
Table 2 6-Genes Significantly Associated with the Overall Survival in the Training-Set Patients
Figure 2 (A) Kaplan–Meier survival curve of patients stratified according to the 6-gene signature in the TCGA training dataset. (B) ROC curve and AUC of the 6-gene signature. (C) Risk score, survival period and gene expression level. (D) The nomogram prediction of OS.
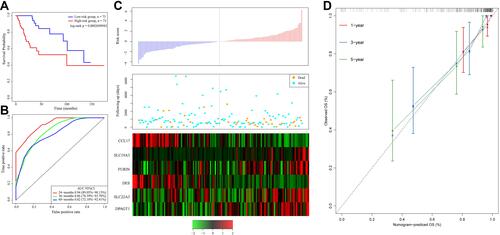
Figure 3 (A) Kaplan–Meier survival curve of patients stratified according to the 6-gene signature in the TCGA test dataset. (B) ROC curve and AUC of the 6-gene signature. (C) Risk score, survival period and gene expression level.
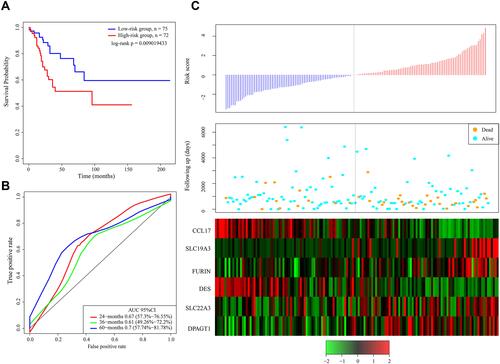
Figure 4 (A) Kaplan–Meier survival curve of patients stratified according to the 6-gene signature in independent validation dataset. (B) ROC curve and AUC of the 6-gene signature. (C) Risk score, survival period and gene expression level.
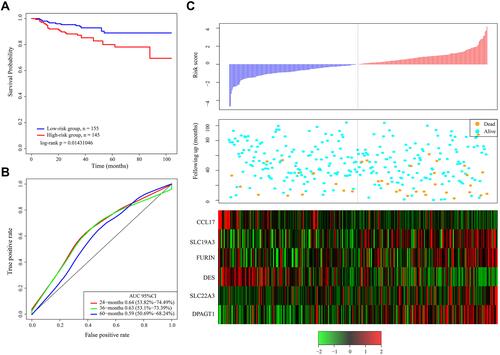
Table 3 Univariate and Multivariate Cox Regression Analysis to Verify the Independence of 6-Gene Signature in Test Datasets
Figure 5 IHC for CCL17, DES, DPAGT1, FURIN, SLC19A3 and SLC22A3. CC-adjacent tissue (N=30) and CC tissue (N=130) samples. CC-adjacent tissue samples with weak immunostaining scores for DPAGT1 (G), FURIN (J), SLC19A3 (M), and SLC22A3 (P) and strong immunostaining scores for CCL17 (A) and DES (D). CC samples with weak and strong immunostaining scores for CCL17 (B and C), DES (E and F), DPAGT1 (H and I), FURIN (K and L), SLC19A3 (N and O) and SLC22A3 (Q and R). The expression of the CCL17, DES, DPAGT1, FURIN, SLC19A3 and SLC22A3 genes is depicted in S slides (X 100). **p < 0.01, ***p < 0.001.
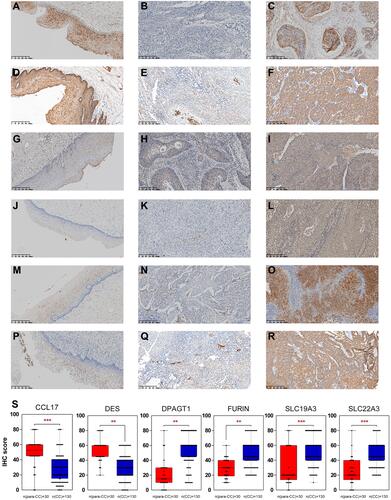
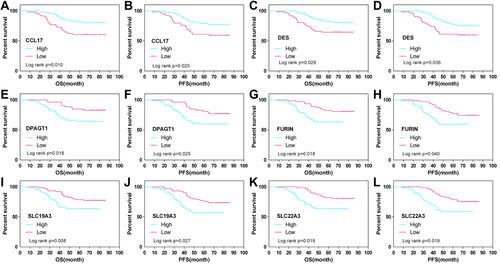
Figure 6 OS and PFS curves for CC (N=130) according to CCL17 (A and B), DES (C and D), DPAGT1 (E and F), FURIN (G and H), SLC19A3 (I and J) and SLC22A3 (K and L) gene expression status (low or high). The expression status for each sample was classified according to the median gene expression value.