Figures & data
Figure 1 Heat map of the differentially expressed genes in seven PDAC samples.
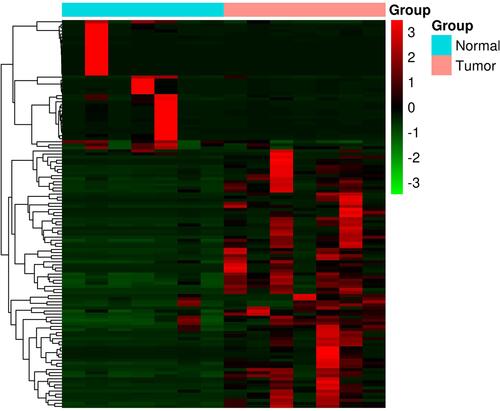
Figure 2 GO and KEGG pathway enrichment analyses for DEGs. (A) Chord plot of GO terms under BP category. (B) Chord plot of GO terms under CC category. (C) Chord plot of GO terms under MF category. (D) Dot plot of KEGG pathway enrichment analyses.
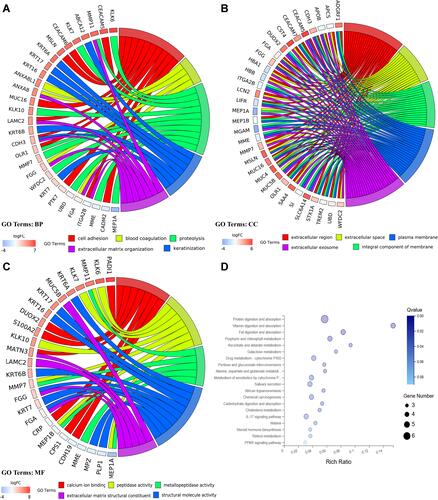
Table 1 KEGG Enrichment Analysis of Top Four Modules Identified from PPI Network
Figure 3 PPI network construction and functional module analysis. The whole PPI network (A). Network of functional module 1 (B). Network of functional module 2 (C). Network of functional module 3 (D). Network of functional module 4 (E).
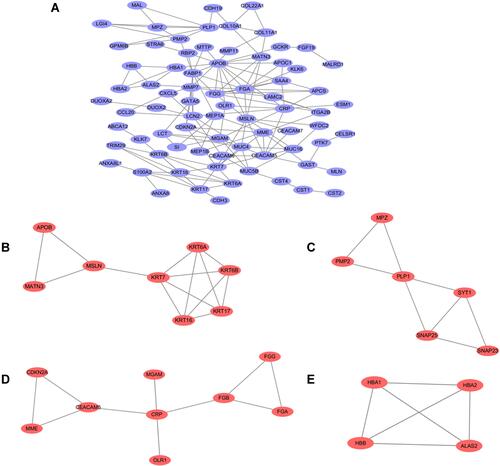
Figure 4 Prognostic survival analysis of CEACAM5, KRT6A, KRT6B, KRT7, KRT17 in PDAC were analyzed by the online server PROGgeneV2 tool, data of survival analysis is from TCGA (https://cancergenome.nih.gov/).
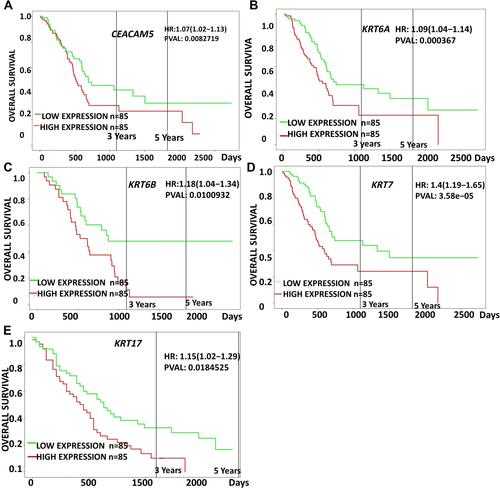
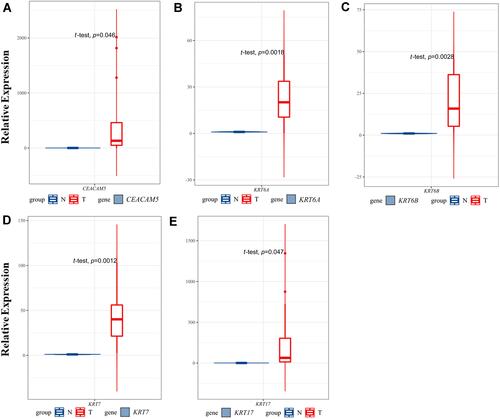
Figure 5 Expression analysis of a CEACAM5, KRT6A, KRT6B, KRT7, KRT17 in normal and tumor pancreatic tissues.
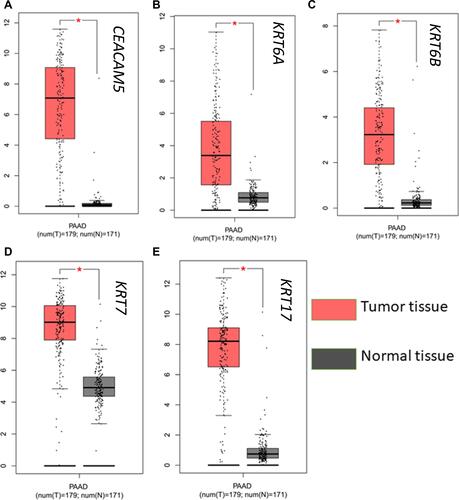
Figure 6 Pearson correlation analyses of CEACAM5, KRT6A, KRT6B, KRT7 and KRT17. CEACAM5 was positively correlated with KRT7 (a); KRT7 was also positively correlated with KRT6A, KRT6B, KRT17 (b, c, d).
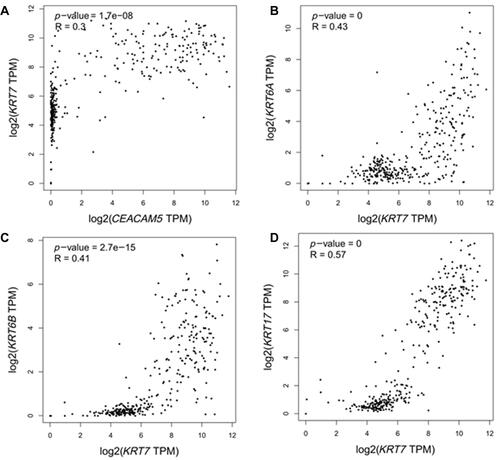
Figure 7 Validation of hub genes expression in PDAC and non-PDAC clinical samples using qRT-PCR. The relative expression level of the five hub genes.