Figures & data
Figure 1 Upregulation of H19 in BC samples. (A) The expression of H19 in BC and adjacent normal tissues was detected via RT-qPCR. (B) The expression of H19 in MCF-10A and two BC cells was detected via RT-qPCR; **P < 0.01.
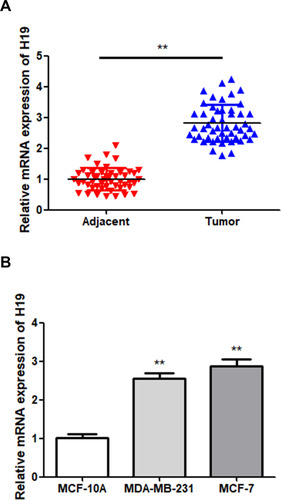
Figure 2 Function of H19 in MDA-MB-231 and MCF-7 cells. (A) RT-qPCR was used to detect the relative expression levels of H19 after silencing. (B–D) Following H19 silencing, CCK8 and colony formation assays were performed to evaluate cell proliferation. (E and F) After H19 silencing, wound healing and Matrigel transwell assays were used to measure cell migration and invasion. (G) Flow cytometry was used to detect apoptosis of H19-silenced cells; *P < 0.05, **P < 0.01.
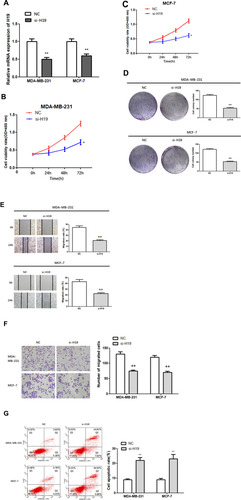
Figure 3 H19 targets miR-130a-3p. (A) Predicted binding sites of miR-130a-3p in H19 3ʹ-UTR. (B and C) Dual-luciferase reporter gene detection and RNA immunoprecipitation assay confirmed the relationship between H19 and miR-130a-3p. (D) MiR-130a-3p was downregulated in BC tissues compared to adjacent normal tissues. (E) MiR-130a-3p level was significantly decreased in BC cells compared to MCF-10A cells. (F and G) The miR-130a-3p mimic increased miR-130a-3p expression compared to negative controls (NC), while miR-130a-3p inhibitor decreased the expression of miR-130a-3p. (H) Negative correlation between H19 and miR-130a-3p expression in breast cancer tissues. **P < 0.01, compared to the NC group; ##P < 0.01, compared to the inhibitor group.
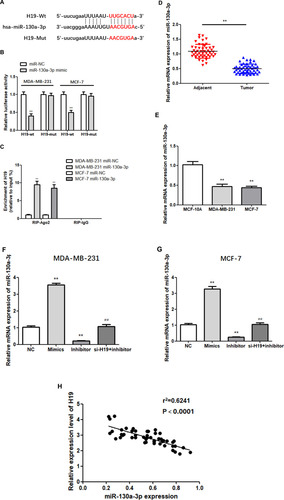
Figure 4 Continued.
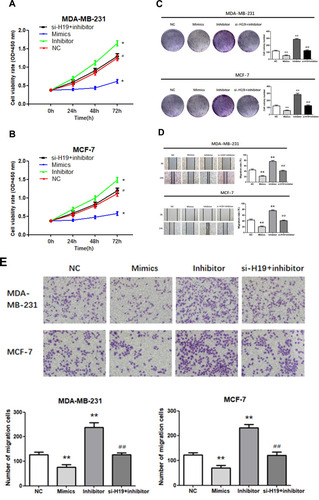
Figure 4 Transfection of cells with miR-130a-3p inhibitor abolished the effects of si-H19. (A and B) CCK-8 assay was used to determine the growth curve. (C) Representative images of colony-forming experiments. (D) Representative images of wound healing assays. (E) Representative results of Matrigel Transwell assay; the number of invading cells is indicated. (F) Detection of apoptosis rates in MDA-MB-231 and MCF-7 cells via flow cytometry. *P < 0.05, **P < 0.01, compared to the NC group; #P < 0.05, ##P < 0.01, compared to the inhibitor group.
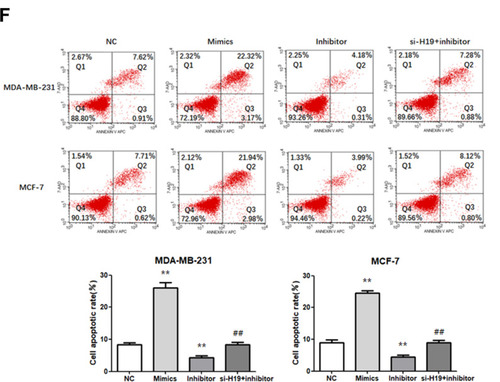
Figure 5 MiR-130a-3p targets the 3ʹ-UTR of SATB1. (A) The predicted binding sites of miR-130a-3p in the SATB1 3′-UTR are shown. (B) Dual-luciferase reporter gene detection confirmed the relationship between miR-130a-3p and SATB1. (C and D) Analysis of SATB1 expression by Western blot. **P < 0.01, compared to the NC group; ##P < 0.01, compared to the inhibitor group.
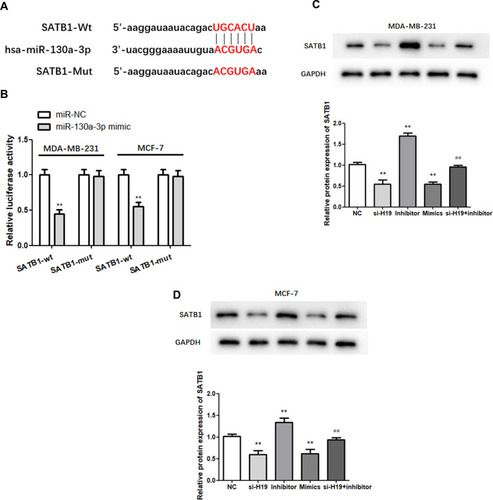
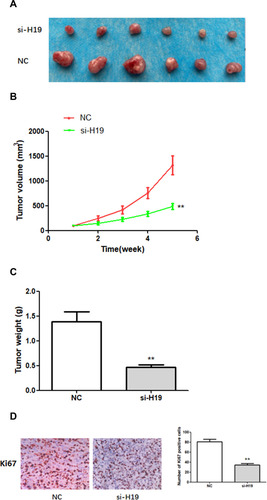
Figure 6 The effects of H19 on the growth of breast cancer cells in vivo. (A–C) H19 suppression significantly inhibited BC development in vivo, as shown by the reduction in tumor volume and weight. (D) In vivo immunohistochemical analysis shows that H19 downregulation inhibited BC development. **P < 0.01, compared with NC group.