Figures & data
Table 1 Correlation Between TRPM2-AS Expression and Clinicopathological Features of Bladder Cancer Patients
Table 2 The Primer Sequences for RT-qPCR
Figure 1 The identification of interested interactome in BLCA. (A) The top 5 most significantly upregulated lncRNAs in BLCA using GEPIA database based on the log2|FC| values. FC: fold change; adj.P: adjusted P value. (B) The top five most significantly upregulated mRNAs in BLCA by analyzing GSE37815 data series. (C) The relative expression of TRPM2-AS in BLCA tissues and healthy tissues from GEPIA database. *P < 0.01. (D) The relative expression of GINS2 in BLCA tissues and healthy tissues from GEPIA database. *P < 0.01. (E) The expression of GINS2 in BLCA tissues based on the TCGA database. **P < 0.0001. (F) The identification of the bridge miRNAs between TRPM2-AS and GINS2 mRNA.
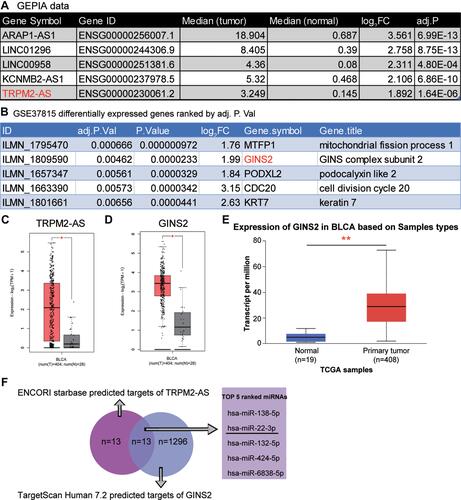
Figure 2 The inhibitory effect of si-TRPM2-AS on the proliferation of bladder cancer was confirmed. (A) The expression of TRPM2-AS was increased in BLCA tissues compared with normal adjacent tissues. N=38, Student’s t-test. (B) The expression of TRPM2-AS was higher in four BLCA cell lines (RT4, T24, J82 and 5637) than that in normal urothelial epithelial cell line SV-HUC-1. *P < 0.05, **P < 0.001 compared with SV-HUC-1 cell, ANOVA. (C) The location of TRPM2-AS was majorly in cytoplasm of T24 and 5637 cells. (D) The transfection effectiveness in T24 and 5637 cell lines after transfecting si-TRPM2-AS, negative control and blank control. **P < 0.001 compared with blank group, ANOVA. (E) CCK-8 assay was used to observe the cell viability in T24 and 5637 cell lines after transfecting si-TRPM2-AS, negative control and blank control at 0, 24, 48, and 72 hours. **P < 0.001 compared with blank group, ANOVA. (F) BrdU assay was used to observe the cell proliferation in T24 and 5637 cell lines after transfecting si-TRPM2-AS, negative control and blank control at 48 hours. *P < 0.05 compared with blank group, ANOVA. (G) Colony formation assay was employed to measure the number of colonies after transfecting si-TRPM2-AS, negative control and blank control. **P < 0.001 compared with blank group, ANOVA.
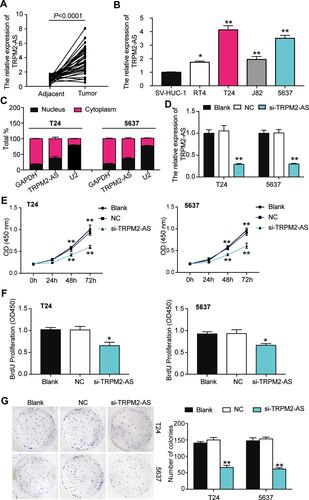
Figure 3 The promoting effect of si-TRPM2-AS on apoptosis of bladder cancer was confirmed. (A) Flow cytometry was employed to measure the cell apoptosis after transfecting si-TRPM2-AS, negative control and blank control. **P < 0.001 compared with blank group, ANOVA. (B) The caspase-3 activity assay was employed to measure the caspase-3 activity after transfecting si-TRPM2-AS, negative control and blank control. **P < 0.001 compared with blank group, ANOVA. (C) Western blot assay was employed to measure the protein expression of Bax, Cleaved caspase-3 and Bcl-2 after transfecting si-TRPM2-AS, negative control and blank control. *P < 0.05, **P < 0.001 compared with blank group, ANOVA.
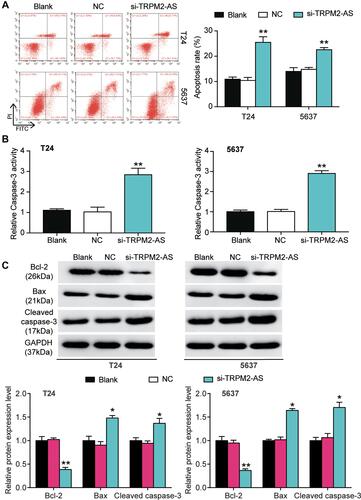
Figure 4 The negative correlation between MiR-22-3p and TRPM2-AS. (A) The combine region sequences of TRPM2-AS and miR-22-3p. (B) Luciferase reporter assay was used to assess the targeting relationship between TRPM2-AS and miR-22-3p. **P < 0.001, ANOVA. (C) RIP assay was used to further confirm the targeting relationship between TRPM2-AS and miR-22-3p. **P < 0.001 compared with IgG group, ANOVA. (D) the expression of miR-22-3p was down-regulated in BLCA tissues compared with normal adjacent tissues. N=38, Student’s t-test. (E) TRPM2-AS expression had a negative relationship with miR-22-3p expression. (F) The expression of miR-22-3p was reduced in T24 and 5637 cells compared with SV-HUC-1 cells. **P < 0.001 compared with SV-HUC-1 cells, ANOVA. (G) The expression of miR-22-3p was increased after transfecting si-TRPM2-AS in T24 and 5637 cells by qRT-PCR analysis. **P < 0.001 compared with blank group, ANOVA.
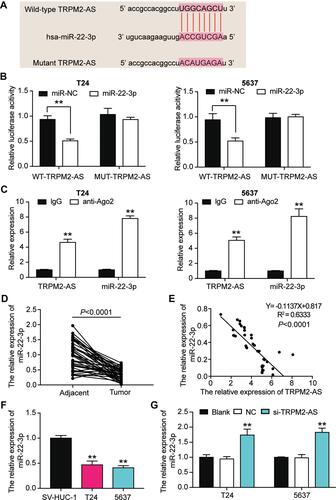
Figure 5 MiR-22-3p inhibitor promoted cell viability and cell proliferation in BLCA cells which was regulated by TRPM2-AS. (A) The transfection efficiency of miR-22-3p inhibitor and TRPM2-AS siRNA. (B) CCK-8 assay was used to observe the cell viability in T24 and 5637 cells after transfecting miR-22-3p inhibitor, si-TRPM2-AS, negative control, blank control and co-transfected miR-22-3p inhibitor and si-TRPM2-AS. (C) BrdU assay was used to observe the cell proliferation in T24 and 5637 cells after transfecting miR-22-3p inhibitor, si-TRPM2-AS, negative control, blank control and co-transfected miR-22-3p inhibitor and si-TRPM2-AS. (D) Colony formation assay was used to observe the number of colonies in T24 and 5637 cells after transfecting miR-22-3p inhibitor, si-TRPM2-AS, negative control, blank control and co-transfected miR-22-3p inhibitor and si-TRPM2-AS. **P < 0.001 compared with blank group, ANOVA.
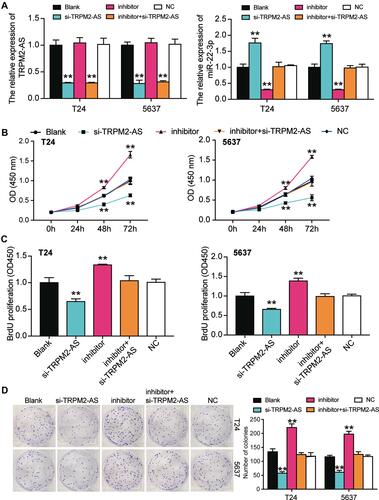
Figure 6 MiR-22-3p inhibitor inhibited cell apoptosis in BLCA cells, which was regulated by TRPM2-AS. (A) Flow cytometry was employed to measure the cell apoptosis in T24 and 5637 cells after transfecting miR-22-3p inhibitor, si-TRPM2-AS, negative control, blank control and co-transfected miR-22-3p inhibitor and si-TRPM2-AS. (B) Caspase-3 activation assay was employed to measure the caspase-3 activation in BLCA cells after transfecting miR-22-3p inhibitor, si-TRPM2-AS, negative control, blank control and co-transfected miR-22-3p inhibitor and si-TRPM2-AS. (C) Western blot assay was employed to measure the protein expression of Bax, Cleaved caspase-3 and Bcl-2 after transfecting miR-22-3p inhibitor, si-TRPM2-AS, negative control, blank control and co-transfected miR-22-3p inhibitor and si-TRPM2-AS. *P < 0.05, **P < 0.001 compared with blank group, ANOVA.
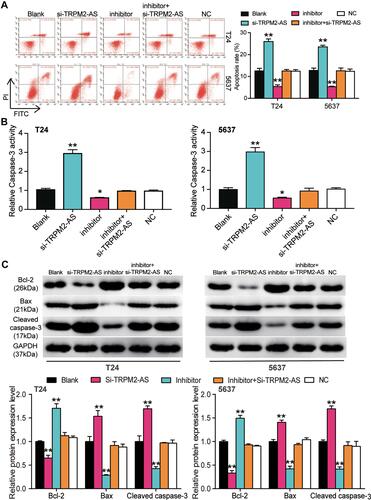
Figure 7 GINS2 was the downstream target gene of miR-22-3p. (A) The binding site of GINS2 3ʹUTR for miR-22-3p. (B) Luciferase reporter assay was used to measure the targeting relationship between miR-22-3p and GINS2. **P < 0.001, ANOVA. (C) RNA pull-down assay was used to further confirm the targeting relationship between TRPM2-AS, miR-22-3p and GINS2. **P < 0.001 compared with bio-NC group, ANOVA. (D) The GINS2 mRNA expression was more in BLCA tissues than that in adjacent normal tissues. N=38, Student’s t-test. (E) MiR-22-3p expression had a negative relationship with GINS2 expression. (F) GINS2 mRNA expression was higher in T24 and 5637 cell lines than that in SV-HUC-1 cells. **P < 0.001 compared with SV-HUC-1 cells, ANOVA. (G) GINS2 protein expression was higher in T24 and 5637 cell lines than that in SV-HUC-1 cells. *P < 0.05, **P < 0.001 compared with SV-HUC-1 cells, ANOVA. (H) GINS2 mRNA expression was increased after transfecting miR-22-3p inhibitor, while GINS2 mRNA expression was reduced after transfecting miR-22-3p mimic. **P < 0.001 compared with blank group, ANOVA.
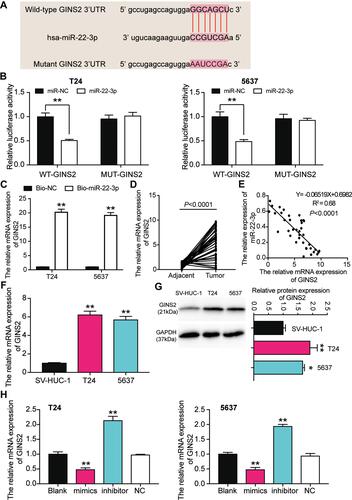
Figure 8 GINS2 silence inhibited cell viability and cell proliferation in bladder cancer cells which was regulated by miR-22-3p. (A) The transfection efficiency of miR-22-3p inhibitor and GINS2 siRNA in the two cell lines. (B) The expression of GINS2 protein was detected by Western blot in BLCA cells after transfecting with miR-22-3p inhibitor, si-GINS2, negative control, blank control and co-transfected miR-22-3p inhibitor and si-GINS2. (C) CCK-8 assay was used to observe the cell viability in T24 and 5637 cell lines after transfecting miR-22-3p inhibitor, si-GINS2, negative control, blank control and co-transfected miR-22-3p inhibitor and si-GINS2. (D) BrdU assay was used to observe the cell proliferation in T24 and 5637 cell lines after transfecting miR-22-3p inhibitor, si-GINS2, negative control, blank control and co-transfected miR-22-3p inhibitor and si-GINS2. (E) Colony formation assay was used to observe the number of colonies in T24 and 5637 cells after transfecting miR-22-3p inhibitor, si-GINS2, normal control, blank control and co-transfected miR-22-3p inhibitor and si-GINS2. *P < 0.05, **P < 0.001 compared with blank group, ANOVA.
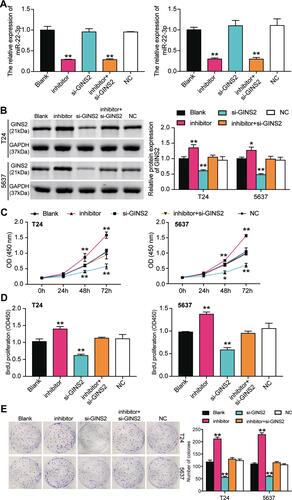
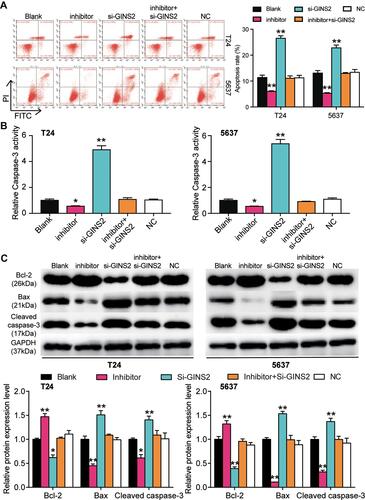
Figure 9 GINS2 silence regulated by miR-22-3p promoted cell apoptosis in bladder cancer cells. (A) Flow cytometry was employed to measure the cell apoptosis after transfecting miR-22-3p inhibitor, si-GINS2, negative control, blank control and co-transfected miR-22-3p inhibitor and si-GINS2. (B) Caspase-3 activity assay was employed to measure the caspase-3 activity after transfecting miR-22-3p inhibitor, si-GINS2, normal control, blank control and co-transfected miR-22-3p inhibitor and si-GINS2. (C) Western blot assay was employed to measure the protein expression of Bax, Cleaved caspase-3 and Bcl-2 after transfecting miR-22-3p inhibitor, si-GINS2, normal control, blank control and co-transfected miR-22-3p inhibitor and si-GINS2. *P < 0.05, **P < 0.001 compared with blank group, ANOVA.