Figures & data
Figure 1 Bioinformatics analysis of NAMPT mRNA expression and the related survival plot in colorectal tissues. (A–G) Data were obtained from the microarray datasets of the Oncomine database. NAMPT was overexpressed in various types of cancers including colorectal cancer in A. High levels of NAMPT mRNA expression were observed in colorectal cancer compared with normal colorectal tissues in the microarray datasets of Skrzypczak in B and C, Hong in D, Gaedcke in E, Kaiser in F, Sabates-Bellver in G, respectively. (H) TCGA-COAD data was used to compare the NAMPT expression in colorectal cancer tissues with normal tissues. (I) Survival plot. The data from GSE17536 showed that high expression of NAMPT mRNA was associated with short overall survival (OS) in CRC patients.
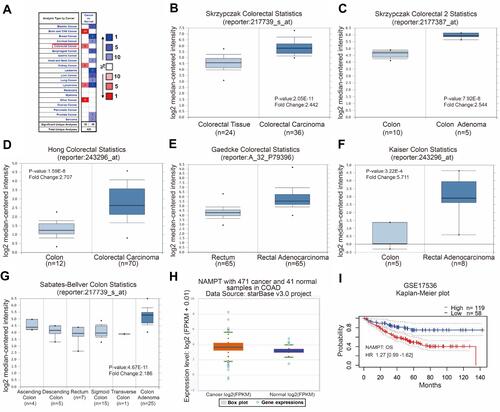
Figure 2 NAMPT silencing inhibited the TGF-β signaling pathway. (A) The starBase online tool in TCGA-COAD data was applied to explore the relationship of NAMPT with Smad2 (left panel) and Smad4 (right panel). (B) HCT116 and Caco2 cells were transfected with si-NAMPT or si-NC for 48 h and incubated in the presence or absence of TGF-β1 (5 ng/mL) for 24 h. The effect of NAMPT knockdown after si-NAMPT transfection was detected by qRT-PCR. (C) The influence of NAMPT silencing on the protein expression of transforming growth factor-β (TGF-β) signaling cascades (p-Smad2, p-Smad3, Smad2, Smad3, and Smad4) was analyzed by Western blot in HCT116 and Caco2 cells. GAPDH was used as a loading control. (D) Histograms showed a semi-quantitative analysis of the relative optical density of protein bands in C. Data were presented as mean ± SEM from three independent experiments. *P < 0.05; **P < 0.01.
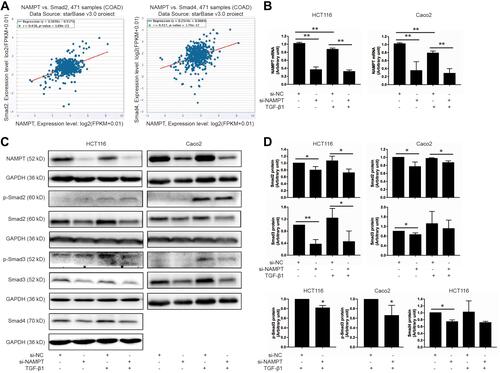
Figure 3 NAMPT overexpression activated the TGF-β signaling pathway and up-regulates ID1 in HCT116 cells. (A) Western blot analysis showed NAMPT overexpression in cells transfected with a plasmid for 72 h. (B) Western blot analysis showed the expression status of the components in the TGF-β signaling (p-Smad2, p-Smad3, Smad2, Smad3. (C) Semi-quantitative analysis of the relative optical density of protein expression in B (n=3). (D) The effect of NAMPT overexpression on Smad4 was detected by Western blot and semi-quantitatively analyzed. (E) ID1 protein expression was detected by Western blot and the relative optical density of protein bands was quantitatively analyzed in cells transfected with a plasmid for 72 h. Data were presented as mean±SEM. Lipo, control cells treated with Lipo8000™ transfection reagent; CTL, cells transfected with empty vector control plasmid; Flag-NAMPT, cells transfected with FLAG-tagged plasmid carrying NAMPT cDNA. *P < 0.05 compared to vector.
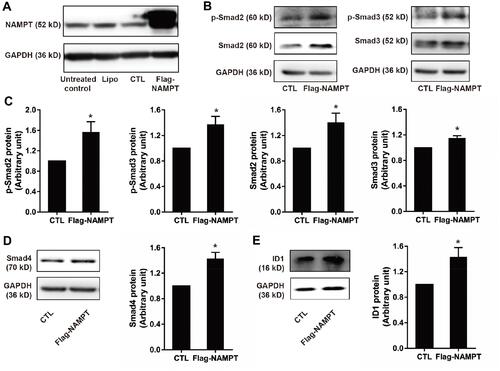
Figure 4 NAMPT promoted the secretion level of TGFβ-1. (A and B) HCT116 and Caco2 cells were transfected with si-NAMPT or si-NC. (C) HCT116 cells were transfected with NAMPT cDNA plasmid or vector control. After treatment for 48 h, cell supernatants were harvested and TGF-β1 concentrations were determined by ELISA. *P < 0.05.
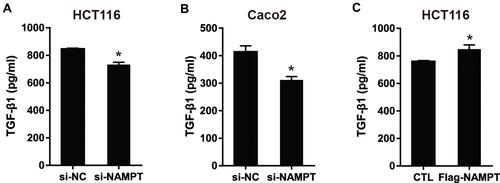
Figure 5 Effect of TGF-β1 on NAMPT expression in colorectal cells. (A) The starBase online tool in TCGA-COAD data was used to explore the relationship between NAMPT and TGFB1. (B) The sequence logo of potential Smad2/3 binding site in JASPAR. (C) HT29, HCT116 and Caco2 cells were treated with TGF-β1 at different concentrations (0, 2.5, 5, and 10 ng/mL) for 24 h. NAMPT mRNA expression was detected by qRT-PCR. (D) NAMPT protein expression was detected by Western blot. (E) Histograms showed the semi-quantitative analysis of the gels from D after densitometry. NAMPT expression was decreased by TGF-β1 treatment at a dose of 5 and 10 ng/mL. Data were presented as mean ± SEM. *P < 0.05; **P < 0.01. n = 3 independent experiments.
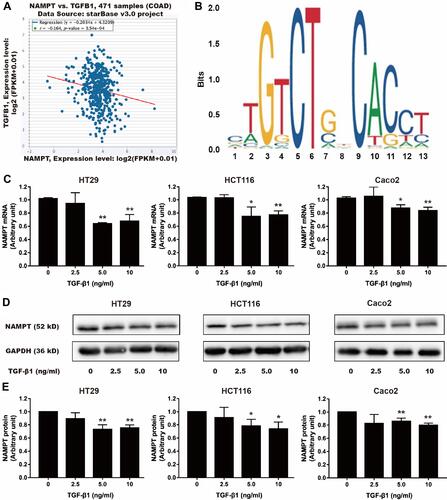
Figure 6 Interaction between NAMPT and miR-1-3p transcripts. (A) Illustration of the sequences of the putative miR-1-3p binding site in the NAMPT 3′-UTR and its mutant. (B) The interaction of miR-1-3p with the NAMPT mRNA at 3′-UTR in HCT116 cells was confirmed by the dual-luciferase reporter assay. Data were presented as the mean ± SEM. *P < 0.05.
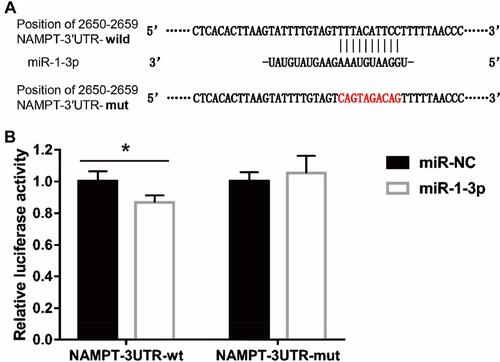
Figure 7 Effect of miR-1-3p mimics and inhibitors on NAMPT mRNA and protein expression in HCT116 cells. Cells were transfected with 50 nM miR-1-3p mimics, anti-miR-1-3p, or their corresponding NC. NAMPT mRNA was detected by qRT-PCR and protein was detected by Western blot at 48 h post-transfection. (A) Detection of NAMPT mRNA after miR-1-3p mimics treatment. (B and C) NAMPT protein expression and densitometry analysis after miR-1-3p mimics treatment. (D) NAMPT mRNA detection after transfection with anti-miR-1-3p. (E and F) NAMPT protein expression and densitometry analysis after transfection with anti-miR-1-3p. n=3; *P < 0.05.
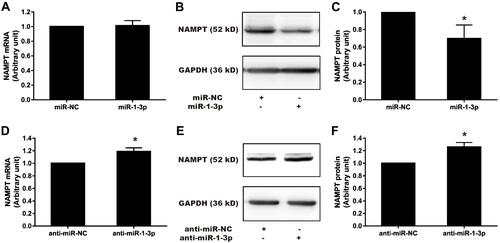
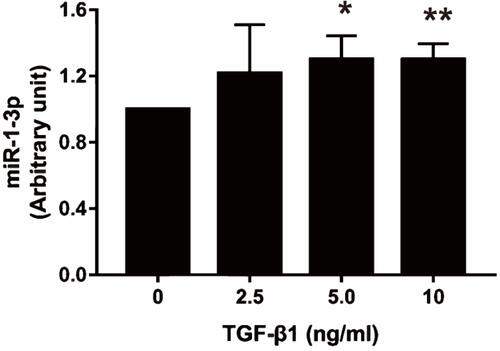
Figure 8 Effect of TGF-β1 on miR-1-3p expression in HCT116 cells. The miR-1-3p expression was detected by qRT-PCR after treatment with TGF-β1 (0, 2.5, 5, and 10 ng/mL) for 24 h. Data were presented as mean ± SEM. n=3; *P<0.05, **P<0.01.