Figures & data
Figure 1 Levels of LINC00460 were highly expressed in HNSCC and associated with poor prognosis. (A) LINC00460 expression in HNSCC tissues and normal tissues in the TCGA database. (B) The expression of LINC00460 in four HNSCC cell lines and normal control cells HaCaT. (C) The relationship between LINC00460 expression and overall survival time of HNSCC patients analyzed using the Kaplan-Meier method. *P < 0.05, ***P < 0.001.
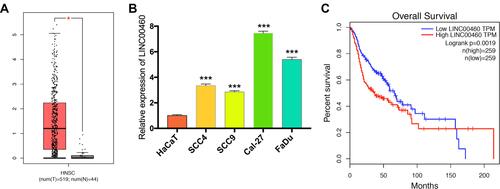
Figure 2 Silencing of LINC00460 attenuated HNSCC cell proliferation, invasion, migration, and EMT. (A) RT-qPCR analysis of LINC00460 mRNA in Cal-27 and FaDu cells treated with sh-LINC00460 (B) CCK-8 assays were applied to detect cell viability of Cal-27 and FaDu cells. (C) Colony formation assays were used to measure cell proliferation ability. (D and E) Representative results of transwell migration assays and invasion assays in Cal-27 and FaDu cells. (F) Relative expression of EMT-related genes in Cal-27 and FaDu cells detected by Western blot analysis. (scale bar: 200 μm for transwell assay). **P < 0.01, ***P < 0.001.
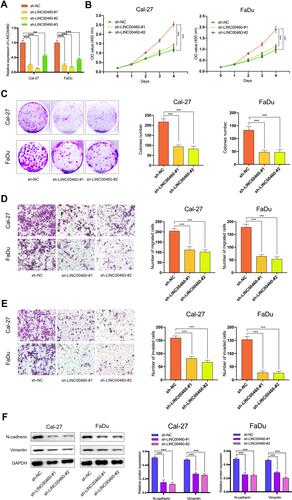
Figure 3 LINC00460 negatively regulated the expression and activity of miR-320a in HNSCC cells. (A) Starbase3.0 revealed the predicted miR-320a binding site in the LINC00460 3ʹUTR, wildtype (WT) and mutated (MUT) 3ʹUTR of LINC00460 was also shown. (B) The relationship between LINC00460 and miR-320a expression of HNSCC patients in the TCGA database (C) Expression of miR-320a in Cal-27 and FaDu cells transfected with sh-LINC00460 or sh-NC. (D) miR-320a markedly reduced luciferase activity in LINC00460-wild not in LINC00460 mut in Cal-27 and FaDu cells. (E) The correlations between LINC00460, miR-320a, and AGO2 were detected in the RIP assay with anti-AGO2 in Cal-27 and FaDu cells. ***P < 0.001.
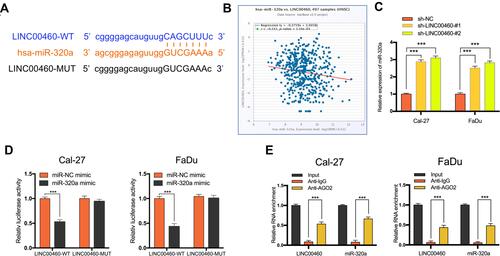
Figure 4 The regulation of LINC00460 on HNSCC cells was mediated by miR-320a. (A–C) CCK-8 assays, transwell migration, and invasion assays were used to detect the cell proliferation ability, cell migration, and invasion ability after transfection Cal-27 and FaDu cells with sh-NC+NC inhibitor, sh-LINC00460-#2+miR-NC inhibitor, or sh-LINC00460-#2+miR-320a inhibitor. (scale bar: 200 μm for transwell assay). (D) Western blot analysis was used to detect the expression of EMT-related genes after transfecting Cal-27 and FaDu cells. **P < 0.01, ***P < 0.001.
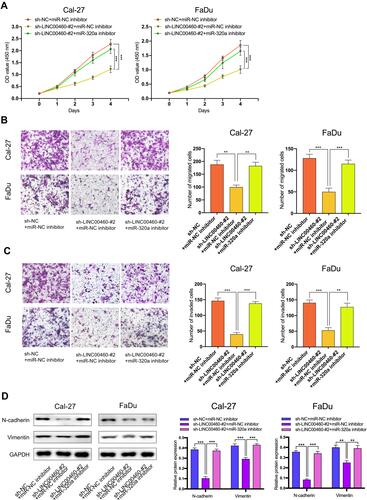
Figure 5 BGN was a target gene of miR-320a and regulated by LINC00460. (A) Starbase3.0 revealed the predicted miR-320a binding site in the BGN 3ʹUTR, wildtype (WT) and mutated (MUT) 3ʹUTR of BGN was also shown. (B) The relationship between miR-320a and BGN expression of HNSCC patients in the TCGA database (C) Relative mRNA and protein levels of BGN in Cal-27 and FaDu cells transfected with miR-NC mimic, miR-320a mimic, miR-NC inhibitor, or miR-320a inhibitor. (D) miR-320a markedly reduced luciferase activity in LINC00460-wild not in LINC00460 mut in Cal-27 and FaDu cells. (E) BGN expression in HNSCC tissues and normal tissues in TCGA database. (F) The relationship between LINC00460 expression and overall survival time of HNSCC patients analyzed using the Kaplan-Meier method. (G) The relationship between LINC00460 and BGN expression of HNSCC patients in the TCGA database (H) Relative mRNA and protein levels of BGN in Cal-27 and FaDu cells transfected with sh-LINC00460 or sh-NC. (I) Relative mRNA and protein levels of BGN in Cal-27 and FaDu cells transfected with sh-NC+miR-NC inhibitor, sh-LINC00460-#2+miR-NC inhibitor, or sh-LINC00460-#2+miR-320a inhibitor. * P< 0.05, ***P < 0.001.
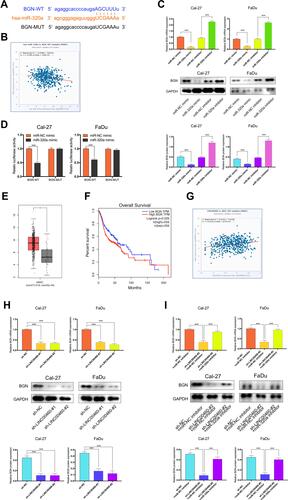
Figure 6 The effect of BGN on HNSCC cells was regulated by miR-320a. (A–C) CCK-8 assays, transwell migration and invasion assays were used to detect the cell proliferation ability, cell migration and invasion ability after transfection Cal-27 and FaDu cells with sh-NC+NC inhibitor, sh-BGN+miR-NC inhibitor, or sh-BGN+miR-320a inhibitor. (scale bar: 200 μm for transwell assay). (D) Western blot analysis was used to detect the expression of EMT-related genes after transfecting Cal-27 and FaDu cells. **P < 0.01, ***P < 0.001.
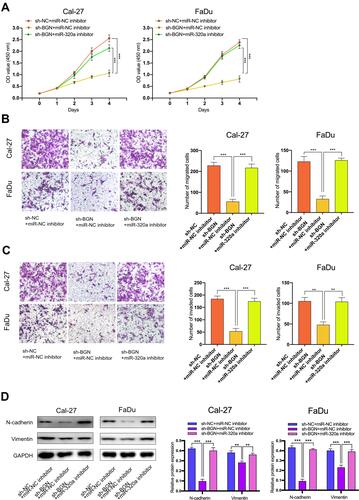
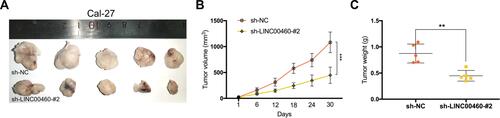
Figure 7 Silencing of LINC00460 inhibited the tumor growth of HNSCC in vivo. (A) Subcutaneous tumors in the nude mouse model under different treatments. (B and C) Analysis of tumor weight and size in different groups. **P < 0.01, ***P < 0.001.