Figures & data
Figure 1 Sinomenine inhibits proliferation of ovarian cancer cell line HeyA8. (A) The survival rate of HeyA8 cells treated with different concentrations of sinomenine (0, 0.25, 0.5, 1.0, 2.0, 4.0, and 8.0 mM) for 48 hours were measured by CCK8 assay. (B) The IC50 of sinomenine was 1.56 mM in HeyA8 cells, which was calculated with the IC50 Calculator on the website (https://www.aatbio.com/tools/ic50-calculator). (C) The growth curves of HeyA8 treated with DMSO as control and sinomenine (1.56 mM) were measured by CCK8 assay. (D) HeyA8 treated with sinomenine formed fewer and smaller colonies than those treated with DMSO. (E) The number of colonies of HeyA8 cells treated with sinomenine and DMSO separately in (D), the value represents the mean ± SD for triplicate samples, **P<0.01, Student’s t-test.
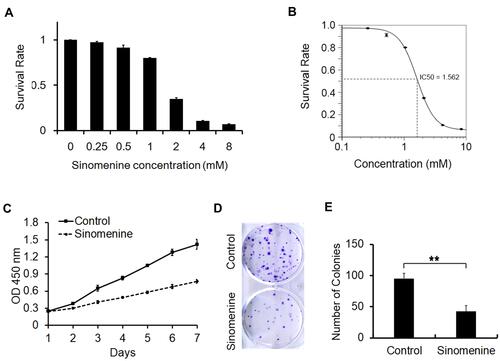
Figure 2 Differentially expressed genes (DEGs) between different treatment groups. (A) Volcano map of DEGs. The horizontal axis represents expression changes (log) of the genes in sinomenine and DMSO treated groups, while the vertical axis showed the statistical significance of the changes in gene expression. The discrepancy was more significant with smaller p values and bigger −log10 (corrected p-value). Each dot in the image represents one gene, the grey dots represent genes with no significant discrepancy, red dots were significantly up-regulated genes and green dots were significantly down-regulated genes. (B) The numbers of DEGs. There were 1323 down-regulated genes and 1356 up-regulated genes. (C) Heatmap of DEGs. Red represents high relative gene expression level and blue represents low relative gene expression level. Con: groups of HeyA8 cells treated with DMSO, SIN: groups of HeyA8 cells treated with sinomenine.
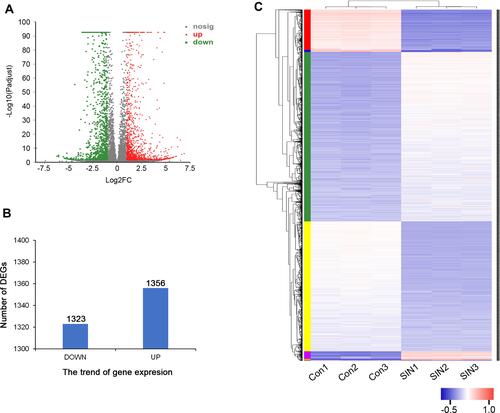
Figure 3 GO and KEGG enrichment analysis of DEGs. (A) Bubble diagram of top 20 ranked GO terms of DEGs. The vertical axis indicates GO terms and the horizontal axis represents the rich factor. The enrichment degree was stronger with a bigger rich factor. The size of dots indicates the number of genes in the GO term. (B) KEGG pathway enrichment analysis of DEGs. The vertical axis represents KEGG pathways. The upper horizontal axis represents the number of genes enriched in the indicated pathway (dots on the yellow line). The lower horizontal axis represents the significant level of enrichment (green bar).
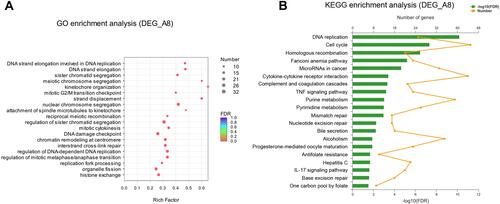
Table 1 Node Genes with Top 18 Ranked Degree in the PPI Network
Figure 4 The network of protein-protein interactions (PPI) of DEGs. (A) The network of PPI. The size of the circles (nodes) represents the degrees of the gene in the PPI network. A greater size indicates a greater degree. (B) Real-time PCR validation of the expressions of top18 degree DEGs. Yellow lines were from the results of the transcriptome data (TPM Value); Black lines were from the results of real-time PCR (Relative Expression). Con: HeyA8 cells treated with DMSO; SIN: HeyA8 cells treated with sinomenine for 48 hours. Three replicates were carried out in the real-time PCR analysis. Bars represent means ± SD (n = 3). (C) Histogram of top 20 ranked GO terms of the real-time PCR validated 18 genes in the PPI network.
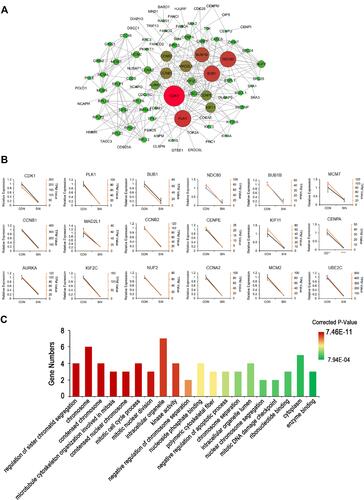
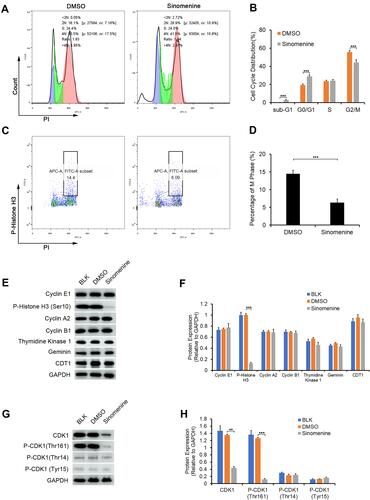
Figure 5 Sinomenine suppressed G2/M transition in HeyA8 cells by inhibiting the expression and the activity of CDK1. (A and B) The cell cycle transition of HeyA8 cells was examined by flow cytometry assay (A). The results showed that the percentage of cells in the G2/M phase was decreased significantly after treatment with sinomenine for 48 hours (B). Each value represents the mean ± SD for triplicate samples. ***P<0.001, Student’s t-test. (C and D) The percentage of M phase cells were analyzed by flow cytometry assay staining with P-Histone H3 (Ser10) and PI (C). The results showed that the percentage of M phase in HeyA8 cells treated with sinomenine for 48 hours were obviously decreased (D). Each value represents the mean ± SD for triplicate samples. ***P<0.001, Student’s t-test. (E) The expression of specific proteins in different cell cycle phase were determined by Western blot. (F) The expression level of P-Histone H3 (ser10), which only expressed in the M phase, were clearly decreased in sinomenine treated HeyA8 cells. Each value represents the mean ± SD for triplicate samples. ***P<0.001, one-way ANOVA analysis. (G) The expression of CDK1 and the phosphorylation of CDK1 were detected by Western blot. (H) The expression level CDK1 and P-CDK1 (Thr161) were clearly decreased in sinomenine treated HeyA8 cells. Each value represents the mean ± SD for triplicate samples. **P<0.01, ***P<0.001, one-way ANOVA analysis.