Figures & data
Figure 1 Associations between EXO1 expression and clinicopathological features in LUAD. (A) EXO1 alterations, as determined by the cBioPortal, including amplification, missense mutation, and truncating mutation. (B) Pan-cancer analysis for expression levels of EXO1 in different types of cancers from the Oncomine. Different expression levels of EXO1 between tumor and normal tissues in LUAD, based on data from the TCGA database (C) and the GSE31210 (D). (E) Different promoter methylation levels of EXO1 in tumor and normal tissues in LUAD. (F) Different expression levels of EXO1 in TP53-mutant and TP53-wild-type groups in LUAD. **p<0.01, p < 0.05 was considered to be significant.
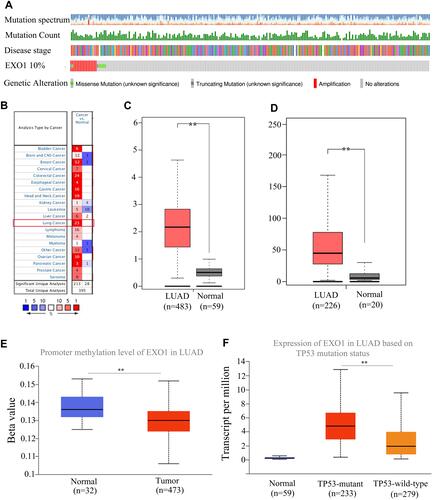
Table 1 Cox Regression Analysis for Overall Survival of LUAD Patients from the TCGA Database
Table 2 Cox Regression Analysis for Overall Survival of 78 LUAD Patients in Our Center
Figure 2 High EXO1 level correlated with clinicopathological features and indicated poor prognosis in LUAD patients among public databases. Box plot showing EXO1 expression levels in tumors based on stage (A), nodal metastasis status (B) and distant metastasis status (C) determined by the UALCAN database. High mRNA expression of EXO1 was correlated with poor DFS (D) and OS (E) in LUAD patients from the TCGA database. Overexpression of EXO1 predicted poor OS in LUAD patients from GSE31210 (F). *p<0.05. p < 0.05 was considered to be significant.
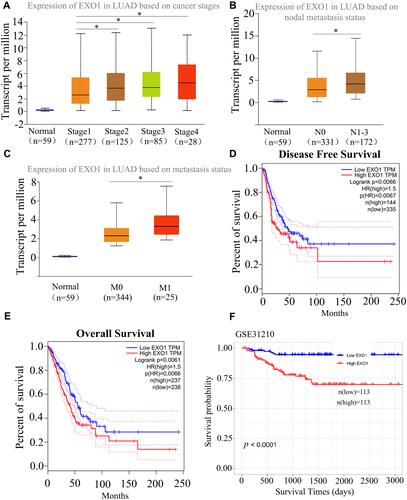
Figure 3 Expression and prognostic value of EXO1 in our cohort. (A) HE staining of EXO1 in tumor and matched normal tissue samples, Scale Bar for × 40 images, 50 μm. Positive staining (brown) of EXO1 was detected in tumoral epithelial cells, macrophages, and partially positive in vascular endothelial cells in tumor tissues. And positive staining of EXO1 in macrophages and partially positive in normal epithelial cells and vascular endothelial cells in normal tissues. EXO1 was negative in stromal cells in both tumor and normal tissues. (B) Immunohistochemistry scores showed that EXO1 was highly expressed in LUAD tumor tissue samples compared with normal tissue samples. (C) Kaplan-Meier survival analysis indicated that a high EXO1 immunohistochemistry score was associated with poor OS in LUAD patients. **p<0.01. p < 0.05 was considered to be significant.
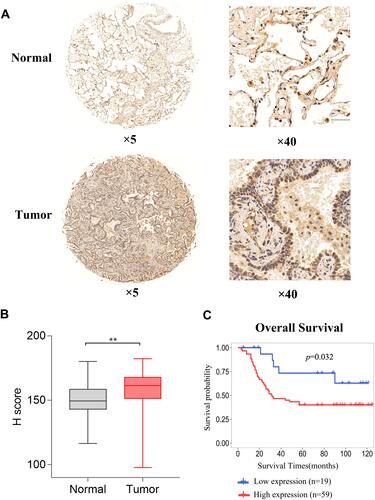
Figure 4 KEGG and GSEA analyses of DEGs in LUAD patients. (A) Volcano plot of DEGs were identified between the EXO1 high and low expression groups. (B) Top 10 biological pathways according to KEGG analysis were shown. (C) Top 10 biological pathways enriched among the EXO1 upregulated DEGs through GSEA were shown. The overlapping pathways of the KEGG and GSEA analyses were Cell cycle (D), oocyte meiosis (E), and DNA replication (F). p < 0.05 was considered to be significant.
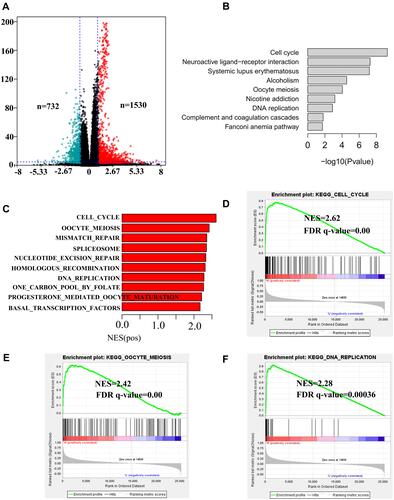
Figure 5 The relationships of EXO1 with immune cells and the PPI network of EXO1. (A) The infiltrating levels of B cells and CD4 + T cells were negatively associated with EXO1 expression in LUAD patients. (B) Survival analysis showed that low levels of B cells and DCs predicted poor OS in LUAD. (C) The top 25 hub genes from the PPI network were shown. p < 0.05 was considered to be significant.
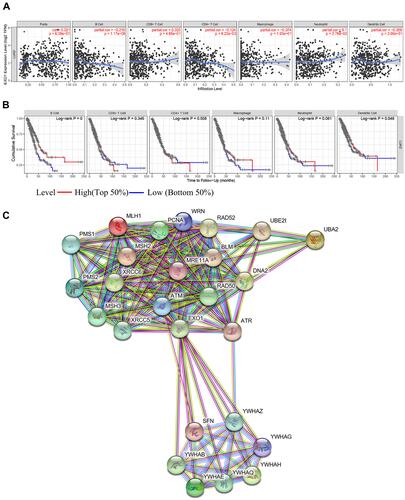
Table 3 Top 25 Hub Genes in PPI Network of EXO1
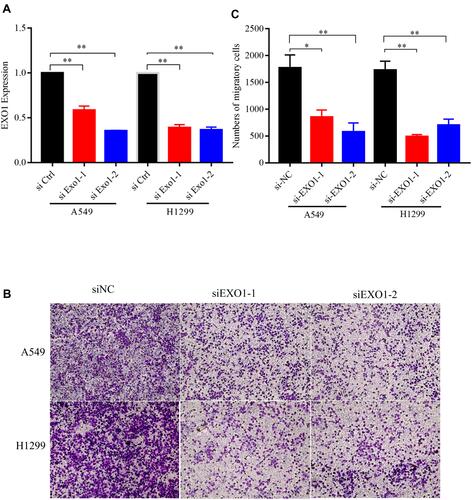
Figure 6 Knockdown of EXO1 inhibited the migratory capacity of lung cancer cells. (A) The knockdown effect of EXO1 was detected by qRT-PCR. (B) The results of transwell migration assays among A549 and H1299 cells. (C) Knockdown of EXO1 significantly decreased migrated cell counts. *p<0.05; **p<0.01. p < 0.05 was considered to be significant.