Figures & data
Table 1 Primers Used in RT-qPCR
Figure 1 Profiles of HOTAIR and miR-34a expression in CSCs of PDAC.
Notes: (A) qRT-PCR results indicating HOTAIR expression in human normal ductal epithelial cells (HPDE6-C7) and PDAC cells (SU.86.86, CFPPAC-1, SW-1990 and PL45). (B and C) SSM-/SFM-CFPAC-1 and (F and G) SSM-/SFM-SW-1990 cells. Expression of CSCs markers, SOX2, Nanog and Oct4 were detected by Western bolt and qRT-PCR, respectively. Levels of HOTAIR and miR-34a expression detected via qRT-PCR in SSM-/SFM-CFPAC-1 (D and E) and SSM-/SFM-SW-1990 cells (H and I). Sphere formation assay of CFPAC-1 (J) and SW-1990 cells cultured in SFM (J); spheres (>40 μm in diameter) were counted. (K) CCK-8 assay was performed to detect cell proliferation. Error bars: means ± SD (n=3 for each group). *P<0.05; **P<0.01 versus SSM-CFPAC-1 or SSM-SW-1990 group.
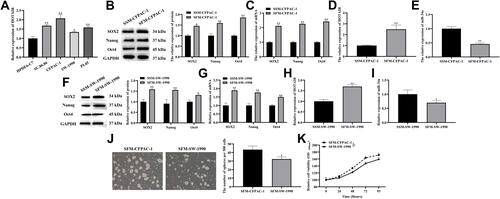
Figure 2 Knocking down HOTAIR inhibited CSCs-like properties, invasion and migration in PDAC.
Notes: Levels of HOTAIR and miR-34a expression were detected via qRT-PCR in CFPAC-1 (A and B) and SW-1990 cells (H and I). Levels of expression of CSCs markers, SOX2, Nanog and Oct4 in CFPAC-1 (C and D) and SW-1990 cells (J and K), were detected via Western blots and qRT-PCR, respectively. (E and L) Cell proliferation detected via CCK-8 assay. (F and M) Detection of sphere formation; spheres (>40 μm in diameter) were counted. (G and N) Detection of invasion and migration of SFM-CFPAC-1 and SFM-SW-1990 cells using the Transwell assay. Error bars: means ± SD (n=3 for each group). *P<0.05; **P<0.01 si-NC or pcDNA3.1-NC group.
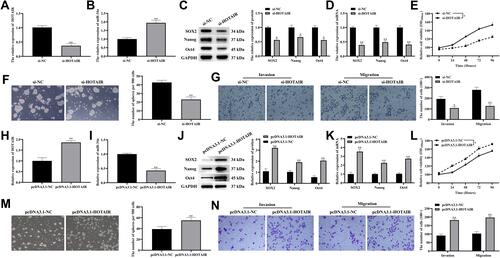
Figure 3 Overexpressing miR-34a inhibited CSCs-like properties, invasion and migration of PDAC.
Notes: Levels of miR-34a and HOTAIR expression in each group of CFPAC-1 (A and B) and SW-1990 cells (H and I) were detected by qRT-PCR. (C, D, J and K) The expression of CSCs markers, SOX2, Nanog and Oct4 were detected by Western bolt and qRT-PCR in each group, respectively. (E and L) CCK-8 assay was performed to detect the cell proliferation. (F and M) Sphere formation assay was performed to detect the sphere formation; spheres (>40 μm in diameter) were counted. (G and N) Transwell assay was performed to detect invasion and migration. Error bars: mean ± SD (n=3 for each group). *P<0.05; **P<0.01 ago-NC or antago-NC group.
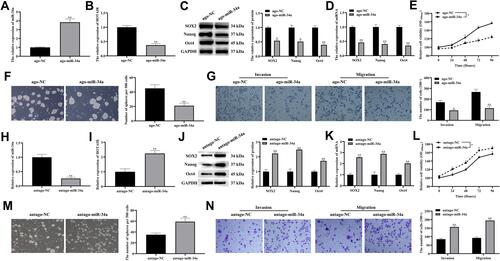
Figure 4 HOTAIR directly targets miR-34a.
Notes: (A) Starbase bioinformatics database predicted the binding region of HOTAIR and miR34a. (B) The targeting relationship between HOTAIR and miR-34a verified by Dual-luciferase reporter gene assay. (C) Profiles of HOTAIR and miR-34a in the same sample pulled down by biotinylated HOTAIR and negative control (NC) probes, detected via qRT-PCR. (D) Determination of HOTAIR’s and miR-34a’s binding ability on Ago2 based on the Ago2-RIP assay. (E) The expression levels of HOTAIR were detected by qRT-PCR. Error bars: means ± SD (n=3 for each group; **P<0.01).
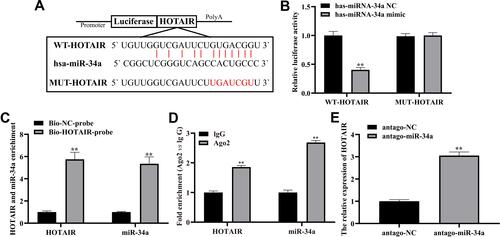
Figure 5 HOTAIR promoted CSCs properties, invasion and migration by interacting with miR-34a to activate the JAK2/STAT3 pathway in PDAC.
Notes: Western blots indicating levels of p-STAT3 and p-JAK2 expression of CFPAC-1 (A) and SW-1990 cells (G) in each group. (B, C, H and I) Expression levels of CSCs markers, SOX2, Nanog and Oct4 in each group, detected using qRT-PCR and Western blot assays. (D and J) Proliferation activity detected via the CCK-8 assay. (E and K) Sphere formation; spheres (>40 μm in diameter) were counted. (F and L) Invasion and migration detected using the Transwell assay. Error bars: mean ± SD (n=3 for each group). *P<0.05; **P<0.01 si-NC and pcDNA3.1-NC group.
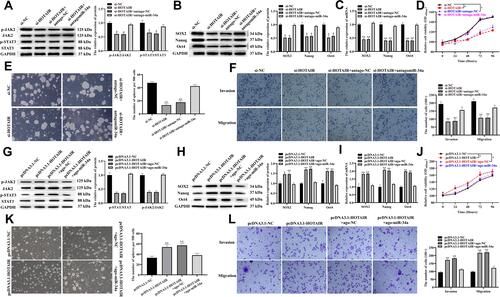
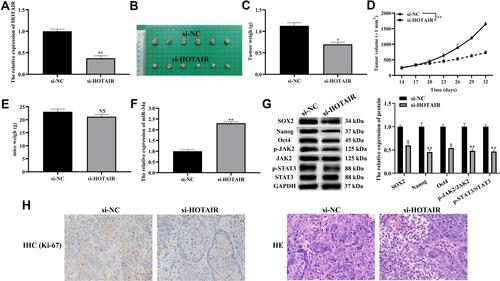
Figure 6 Knocking down HOTAIR inhibited tumorigenicity of CFPAC-1 cells.
Notes: (A) qRT-PCR was used to detect the expression levels of HOTAIR in si-NC and si-HOTAIR groups. (B) Tumor diagram of si-NC and si-HOTAIR groups. (C and D) Tumor mass and volume of si-NC and si-HOTAIR groups. (E) The mass of nude mice in si-NC and si-HOTAIR groups. (F) qRT-PCR was used to detect the expression levels of miR-34a in si-NC and si-HOTAIR groups. (G) Western blot was used to detect the expression levels of protein in si-NC and si-HOTAIR groups. (H) IHC (Ki-67) and HE staining of tumor tissues in si-NC and si-HOTAIR groups. Error bars: mean ± SD (n=6 for each group). *P<0.05; **P<0.01 si-NC group.