
Figures & data
Table 1 Clinicopathological Characteristics of Patients
Figure 1 ROC curve analysis to evaluate the predictive value of preoperative (A) LCR, (B) AGR, (C) LMR and (D) CAR for OS in patients with osteosarcoma.
Abbreviations: ROC, receiver operating characteristic curves; LCR, lymphocyte-to-C-reactive protein ratio; AGR, albumin‐to‐globulin ratio; LMR, lymphocyte–monocyte ratio; CAR, C-reactive protein to albumin ratio; OS, overall survival.
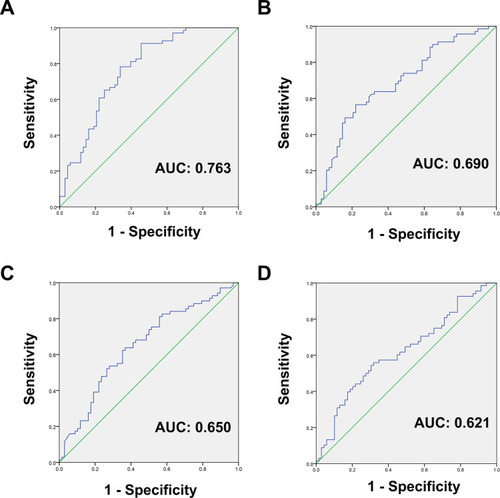
Figure 2 Kaplan–Meier survival curves for OS in osteosarcoma patients according to (A) LCR, (B) AGR, (C) LMR and (D) CAR.
Abbreviations: OS, overall survival; LCR, lymphocyte-to-C-reactive protein ratio; AGR, albumin‐to‐globulin ratio; LMR, lymphocyte–monocyte ratio; CAR, C-reactive protein to albumin ratio.
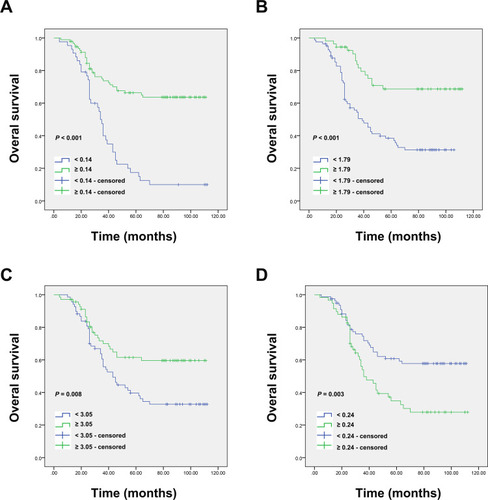
Table 2 Univariate and Multivariate Cox Regression Analyses of Factors Associated with Overall Survival