Figures & data
Figure 1 (A) Low expression of KRT17 in cancer tissues (a, magnification, ×4; b, magnification, ×10; c, magnification, ×20; d, magnification, ×40). (B) High expression of KRT17 in cancer tissues (a, magnification, ×4; b, magnification, ×10; c, magnification, ×20; d, magnification, ×40). (C) Low expression of KRT17 in the adjacent tissues (a, magnification, ×4; b, magnification, ×10; c, magnification, ×20; d, magnification, ×40). (D) High expression of KRT17 in the adjacent tissues (a, magnification, ×4; b, magnification, ×10; c, magnification, ×20; d, magnification, ×40).
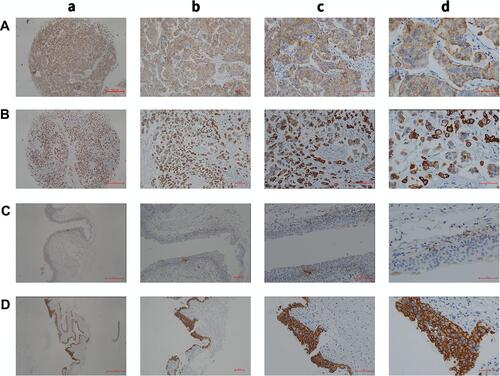
Figure 2 High mRNA expression level of KRT17 in tumor tissues in the online database GEPIA.
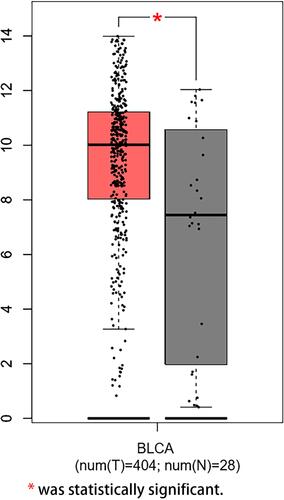
Figure 3 High mRNA expression level of KRT17 in tumour tissues using qRT-PCR.
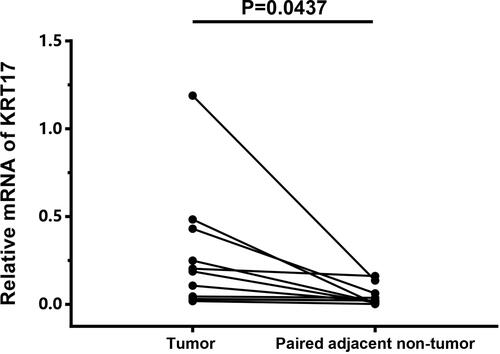
Table 1 The Relationship Between the Expression of KRT17 and Clinicopathological Data
Figure 4 (A) Kaplan–Meier analysis of overall survival (OS) in patients with bladder cancer. (B) Kaplan-Meier analysis of progression-free survival (PFS) in patients with bladder cancer.
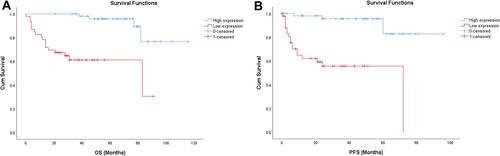
Table 2 Univariate Analysis of Clinical Factors on 101 Patients with OS
Table 3 Multivariate Analysis of Clinical Factors in 101 Patients with OS
Figure 5 Prediction model of nomogram construction.
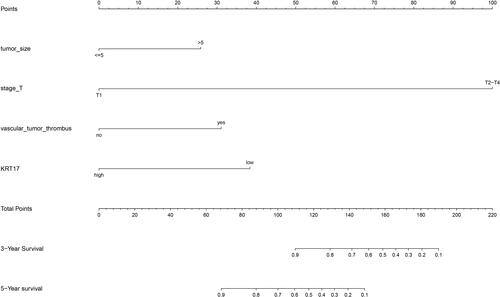
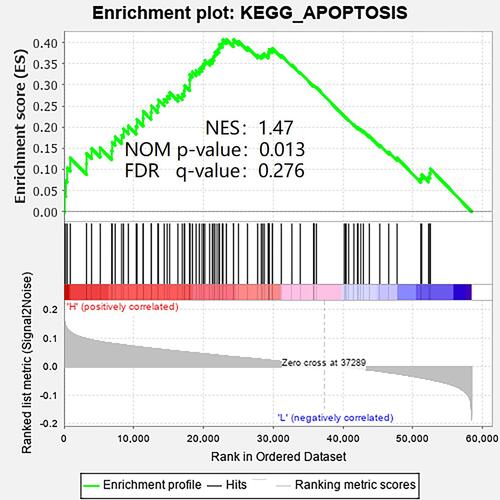
Figure 6 The GSEA result showed the most relevant enrichment pathway.