Figures & data
Figure 1 LBP enhanced 125I-induced apoptosis in NSCLC cells. (A) After treatment with LBP concentrations ranging from 0 to 80 µg/mL for 72 h on A549, H1975, and H157 cells, the CCK-8 assay was used to determine cell proliferation; optical density values were detected using a microplate reader; the sensitization concentration was defined as 10% of IC50. (B and C) After cells were treated with 125I, LBP (10% of IC50), or their combination on A549 and H1975 cells, Annexin V-FITC/PI was performed to analyze cellular apoptosis. The data are presented as the mean ± SD. One-way ANOVA was used for data analysis; *P < 0.05, **P < 0.01, ***P < 0.001.
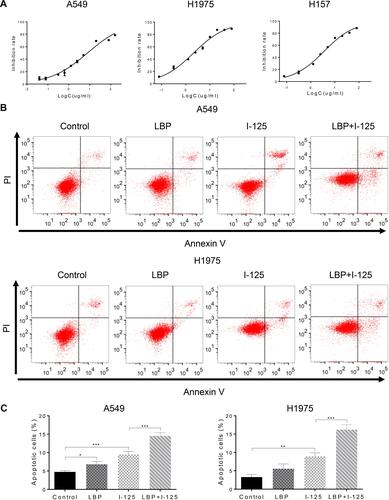
Figure 2 LBP enhanced 125I-induced apoptosis in NSCLC cells. (A and B) After NSCLC cells were treated with 125I, LBP (10% of IC50), or their combination, TUNEL assay in A549 cells was performed and Bax/Bcl-2 expression level in A549, H1975, and H157 cells was detected to analyze cellular apoptosis. The data are presented as the mean ± SD. One-way ANOVA was used for data analysis; *P < 0.05, **P < 0.01, ***P < 0.001.
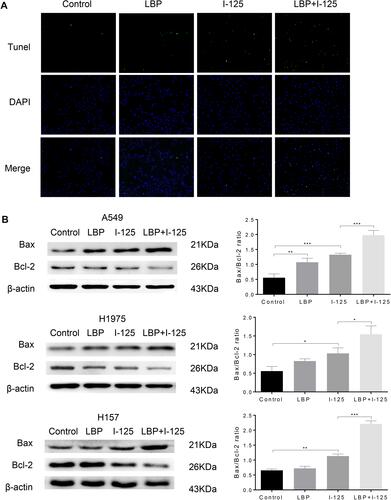
Figure 3 LBP increased 125I-induced anti-proliferative effect in NSCLC cells. (A and B) After treatment with 125I, LBP (10% of IC50), or their combination, cell cycle analysis was performed to verify the anti-proliferative effect of LBP and 125I on A549 and H1975 cells. The data are presented as the mean ± SD. One-way ANOVA was used for data analysis; *P < 0.05, **P < 0.01, ***P < 0.001.
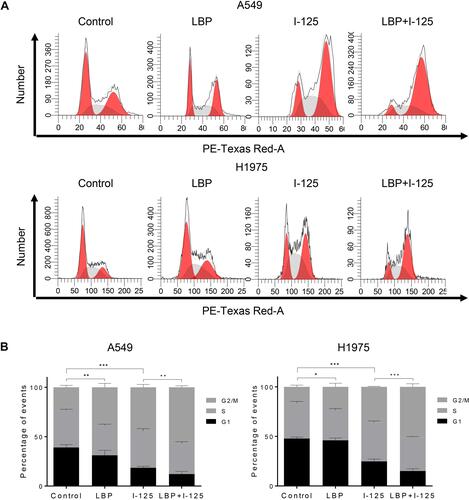
Figure 4 LBP increased 125I-induced anti-proliferative effect in NSCLC cells. (A) After treatment with 125I, LBP (10% of IC50), or their combination, the proliferation of A549, H1975, and H157 cells was detected by CCK-8 assay at 0, 24, 48, and 72 h. (B) The EdU assay were performed to verify the anti-proliferative effect of LBP and 125I on A549 cells. The data are presented as the mean ± SD. One-way ANOVA was used for data analysis; *P < 0.05, **P < 0.01, ***P < 0.001.
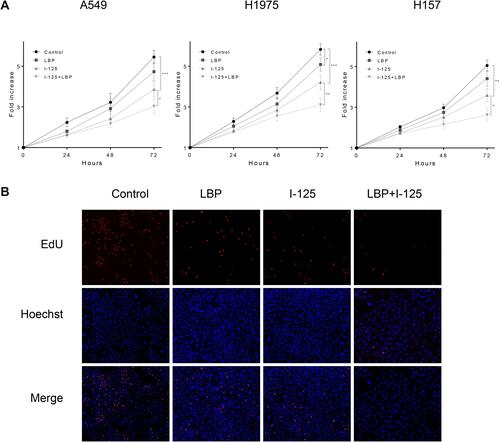
Figure 5 LBP facilitated 125I-induced tumor growth inhibition in vivo. To further verify the combined effect of LBP and 125I in vivo, an A549 xenograft tumor nude mouse model was established. (A) After single or combined treatment for 27 days, the mice were sacrificed and tumors were excised. (B) The tumor weight was measured every other day for 27 days. The data are presented as the mean ± SD. One-way ANOVA was used for data analysis; *P < 0.05, **P < 0.01.
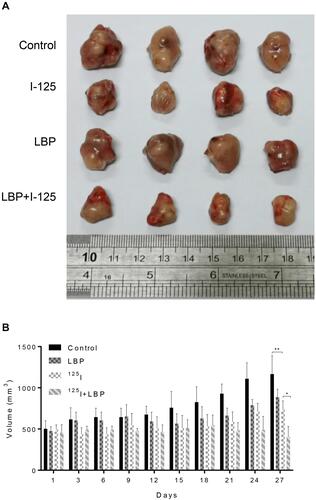
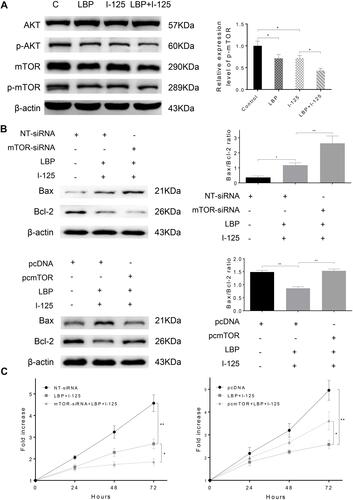
Figure 6 LBP increased the 125I-induced down-regulation of the AKT/mTOR pathway. (A) After treatment with 125I, LBP (10% of IC50), or their combination on A549 cells, the expression level of AKT/mTOR signaling was detected by Western blot. (B and C) The Bax/Bcl2 ratio and cell viability in A549 cells were detected after the expression of mTOR was down-regulated or up-regulated by siRNA or pcDNA. The data are presented as the mean ± SD. One-way ANOVA was used for data analysis; *P < 0.05, **P < 0.01.