Figures & data
Table 1 Expression of the 13 N6-Methyladenosine (m6A) RNA Methylation Regulators in Renal Cell Carcinoma (RCC)
Figure 1 Expression levels of m6A RNA methylation regulators in RCC. (A) Heatmap of the expression of 13 m6A RNA methylation regulators in RCC tissues compared to normal tissues. (B) Violin plots of the expression of the 13 regulators in RCC. (C) Spearman correlation analysis of the 13 regulators in RCC. *P<0.05, **P<0.01, and ***P<0.001.
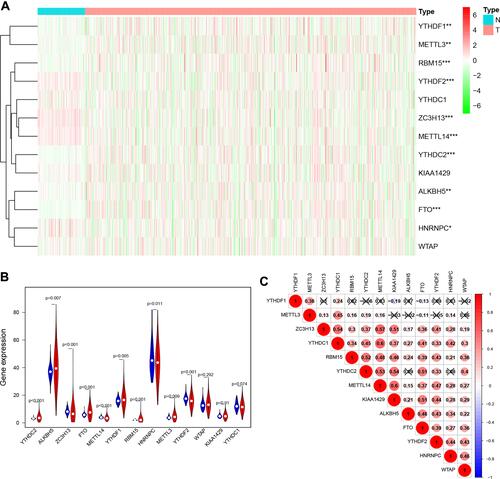
Figure 2 Consensus clustering analysis of RCC cases. (A) CDF curves for k=2–9. (B) Relative change in the area under the CDF curves for k=2–9. (C) Consensus matrix for k=2. (D). Tracking plot of cases for k=2–9. (E). Principal component analysis plot based on the RNA expression profiles of the 13 major m6A regulators, which grouped the cases into two clusters. Red: cluster 1; blue: cluster 2.
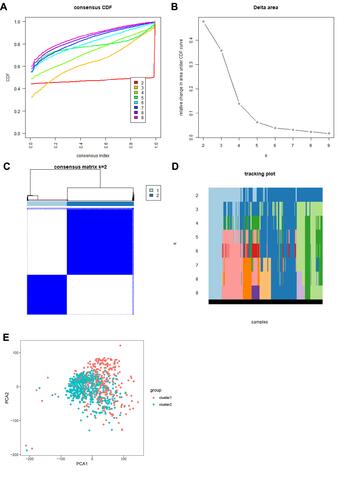
Figure 3 Overall survival and clinicopathological characteristics of RCC patients in the two clusters. (A) Kaplan–Meier curves of overall survival of RCC patients in clusters 1 (red) and 2 (blue). (B) Heatmap showing the associations between clinicopathological characteristics and the expression of each of the 13 m6A RNA methylation regulators in clusters 1 and 2. Red: upregulated; green: downregulated. **P<0.01.
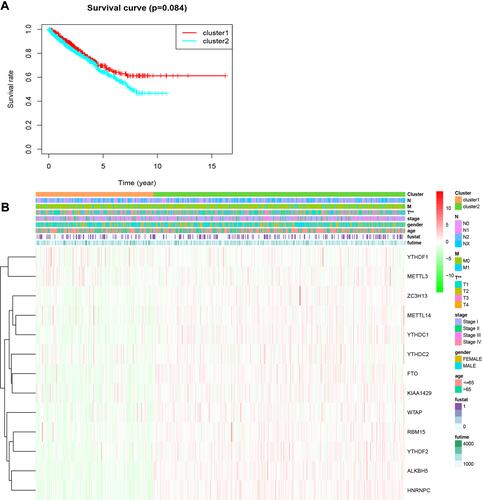
Figure 4 Identification of risk signature based on m6A RNA methylation regulators. (A) Univariate Cox regression results (hazard ratio, 95% confidence interval) for the 13 m6A RNA methylation regulators. (B and C) Coefficients from the multivariate LASSO Cox regression. LASSO: least absolute shrinkage and selection operator.
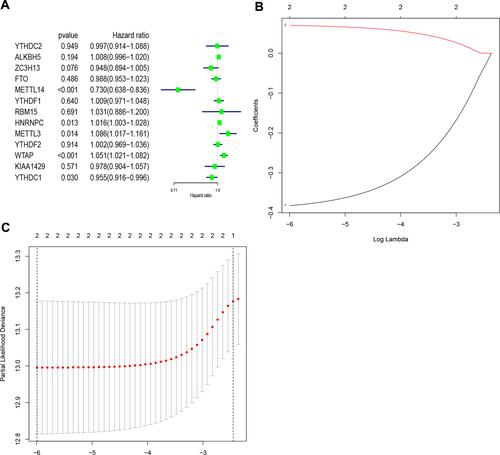
Table 2 Clinical Characteristics of the Patients in High- and Low-Risk Groups (Based on the Median Risk Score)
Figure 5 Overall survival and clinicopathological characteristics of RCC patients in the high- and low-risk groups. (A). Kaplan–Meier curves of overall survival of patients in the high- and low-risk groups (based on the median risk score involving two m6A RNA methylation regulators). (B) Receiver operating characteristic curve showing the predictive performance of the risk model. (C) Heatmap showing the associations between clinicopathological characteristics and the expression of two m6A RNA methylation regulators (METTL14 and WTAP) in the high- and low-risk groups. Red: upregulated; green: downregulated. *P<0.05 and ***P<0.001.
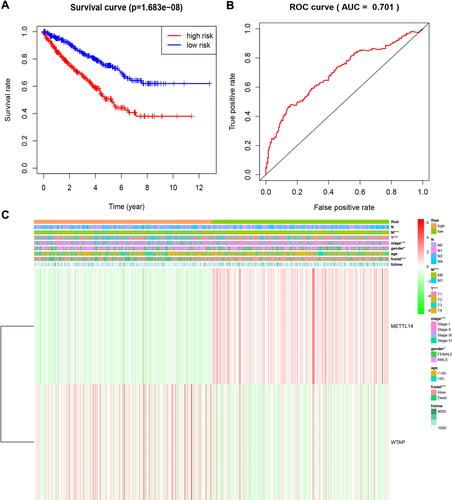
Figure 6 Kaplan–Meier curves of overall survival of RCC patients in the high- and low-risk groups (based on the median risk score involving two m6A RNA methylation regulators) in the Gene Expression Omnibus dataset.
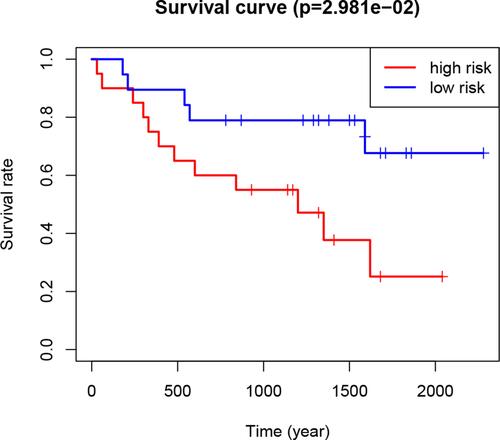
Figure 7 Associations between the clinicopathological characteristics and overall survival of RCC patients. (A) Univariate and (B) multivariate Cox regression results (hazard ratio, 95% confidence interval) indicating the associations between the clinicopathological characteristics and the overall survival of RCC patients.
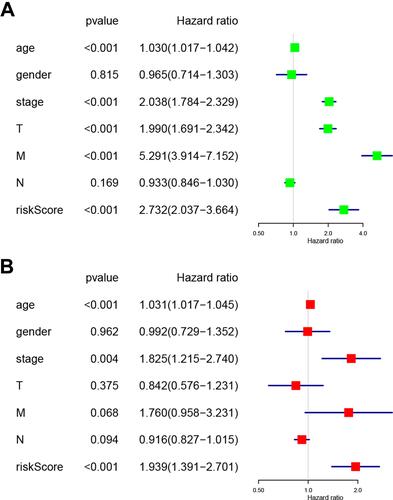
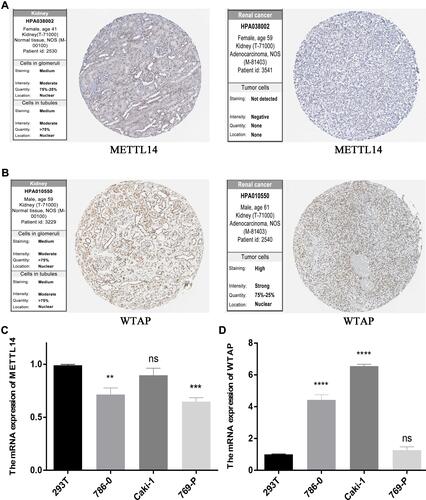
Figure 8 METTL14 and WTAP levels. (A) METTL14 and (B) WTAP protein expression in normal and RCC tissues from the Human Protein Atlas, as detected by immunohistochemical analysis. (C) METTL14 and (D) WTAP mRNA expression in normal (293T) and RCC cell lines. **P<0.01, ***P<0.001, and ****P<0.0001.