Figures & data
Table 1 Primers Used in the Study
Figure 1 KCNQ1OT1 expression. (A) UALCAN analysis of KCNQ1OT1 expression in TCGA database; (B) UALCAN analysis of KCNQ1OT1 expression with different Gleason score; (C) RT-PCR results of KCNQ1OT1 expression in tumor and paracancerous tissues; (D) RT-PCR results of KCNQ1OT1 expression in DU145, LNCaP and RWPE-1 cells.

Figure 2 Effects of KCNQ1OT1 on proliferation, invasion and metastasis of prostate cancer cells. (A) The expression level of KCNQ1OT1 after si-RNA being transfected into DU145 cells; (B) The expression level of KCNQ1OT1 after si-RNA being transfected into LNCaP cells; (C) The DU145 cell proliferation was decreased after down regulation of the KCNQ1OT1 expression (**P<0.01); (D) The LNCaP cell proliferation was decreased after down regulation of the KCNQ1OT1 expression (**P<0.01); (E) Cell migration and invasion decreased after down regulation of the KCNQ1OT1 expression in DU145 cells; (F) Cell migration and invasion decreased after down regulation of the KCNQ1OT1 expression in LNCaP cells.
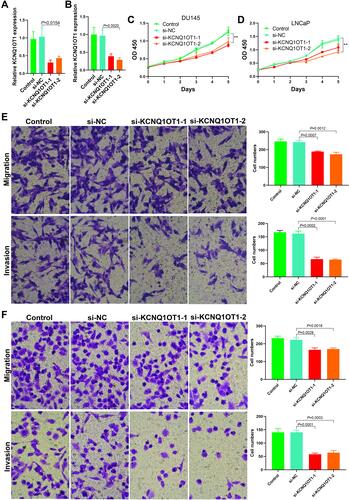
Figure 3 KCNQ1OT1 functions as a ceRNA and sponges miR-211-5p. (A) The binding sites of KCNQ1OT1 with miR-211-5p and miR-211-5p with CHI3L1 3ʹ-UTR were predicted by ENCORI analysis, and the corresponding wild-type and mutant luciferase reporter gene plasmids were constructed; (B) The targeting effect of KCNQ1OT1 and miR-211-5p was analyzed; (C) The targeting effect of CHI3L1 3ʹ-UTR and miR-211-5p was analyzed; (D) The effect of down regulating KCNQ1OT1 on miR-211-5p expression in DU145 cells detected by RT-PCR; (E) The effect of overexpressed KCNQ1OT1 on miR-211-5p expression in LNCaP cells detected by RT-PCR; (F) The effect of changing KCNQ1OT1 and miR-211-5p levels on YKL-40 expression in DU145 cells detected by RT-PCR and Western blot; (G) The effect of changing KCNQ1OT1 and miR-211-5p levels on YKL-40 expression in LNCaP cells detected by RT-PCR and Western blot; (H) The enrichment of KCNQ1OT1 and miR-211-5p by Ago2 antibody analyzed by RIP assay; (I) SNRNP70 antibody was used as positive control in RIP assay.
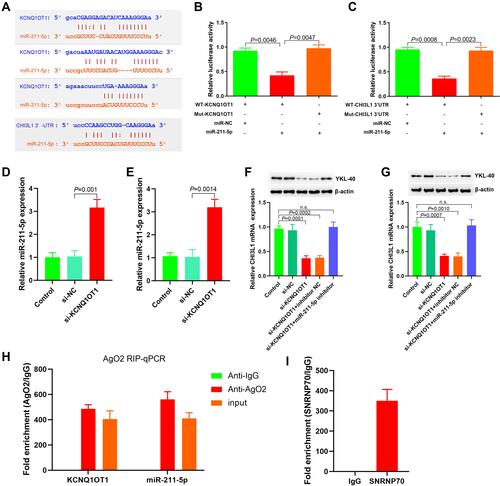
Figure 4 Effect of miR-211-5 on proliferation, invasion and metastasis of prostate cancer cells. (A) The expression level of miR-211-5 after transfection of miR-211-5 mimics into DU145 cells; (B) The expression level of miR-211-5 after transfection of miR-211-5 mimics into LNCaP cells; (C) Cell proliferation decreased after transfection of miR-211-5 mimics into DU145 cells (**P<0.01); (D) Cell proliferation decreased after transfection of miR-211-5 mimics into LNCaP cells (**P<0.01); (E) Matrigel invasion and transwell migration assays showed decreased cell migration and invasion after transfection of miR-211-5 mimics into DU145 cells; (F) Matrigel invasion and transwell migration assays showed decreased cell migration and invasion after transfection of miR-211-5 mimics into LNCaP cells.
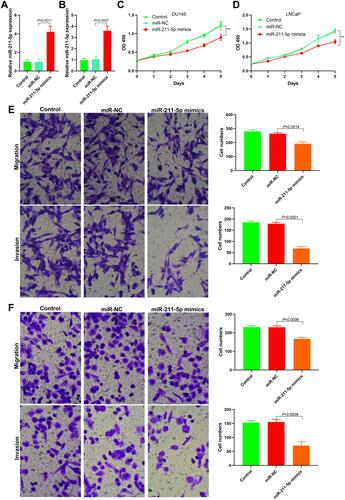
Figure 5 Effect of CHI3L1 expression on proliferation, invasion and metastasis of prostate cancer cells. (A) The expression level of CHI3L1 after transfection of CHI3L1 siRNA into DU145 cells; (B) The expression level of CHI3L1 after transfection of CHI3L1 siRNA into LNCaP cells; (C) Cell proliferation decreased after transfection of CHI3L1 siRNA into DU145 cells (**P<0.01); (D) Cell proliferation decreased after transfection of CHI3L1 siRNA into LNCaP cells (**P<0.01); (E) Matrigel invasion and transwell migration assays showed decreased cell migration and invasion after transfection of CHI3L1 siRNA into DU145 cells; (F) Matrigel invasion and transwell migration assays showed decreased cell migration and invasion after transfection of CHI3L1 siRNA into LNCaP cells.
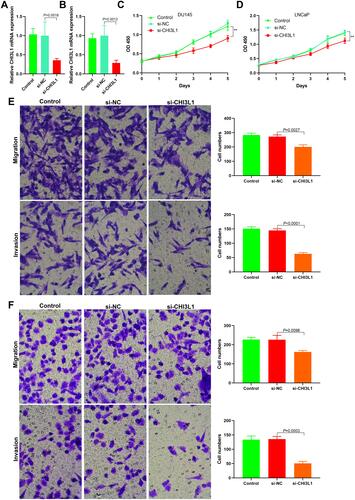
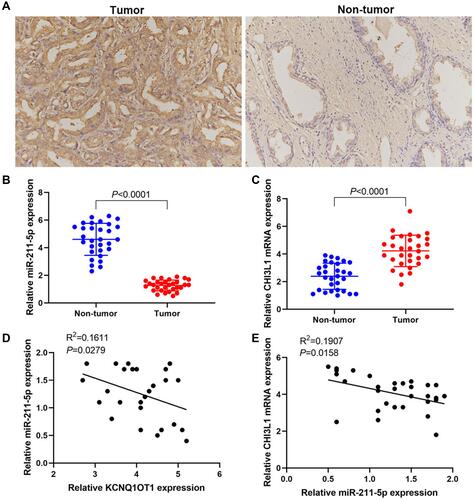
Figure 6 lncRNA KCNQ1OT1/miR-211-5p/CHI3L1 signal axis exists in prostate cancer. (A) Immunohistochemical results of YKL-40 expression; (B) RT-PCR results of miR-211-5p expression; (C) RT-PCR results of CHI3L1 mRNA expression; (D) Correlation analysis of KCNQ1OT1 and miR-211-5p expression levels; (E) Correlation analysis of miR-211-5p and CHI3L1 mRNA expression levels.