
Figures & data
Table 1 Frequency of miR-483-3p Expression in PanIN Lesions and PDAC by LNA-ISH
Figure 1 miR-483-3p expression by LNA-ISH and SMAD4 protein expression by immunohistochemistry in PanIN lesions and PDAC tissues. (A) Expression of miR-483-3p was detected in the cytoplasm of normal pancreatic acini but not in normal pancreatic ducts. An increase in staining intensity for miR-483-3p was observed across the progression of normal pancreatic ducts to PanIN-1 (D), PanIN-2 (G), PanIN-3 (J) and PDAC (M) lesions. Protein expression of the putative miR-483-3p target gene SMAD4 was detected in normal pancreatic acini and ducts (B), as well as PanIN-1 (E) and PanIN-2 (H) lesions, but decreased in PanIN-3 (K) and PDAC (N) lesions. (C, F, I, L, O) Hematoxylin and eosin (HE) staining for normal pancreas (C), PanIN-1 (F), PanIN-2 (I), PanIN-3 (L) and PDAC (O).
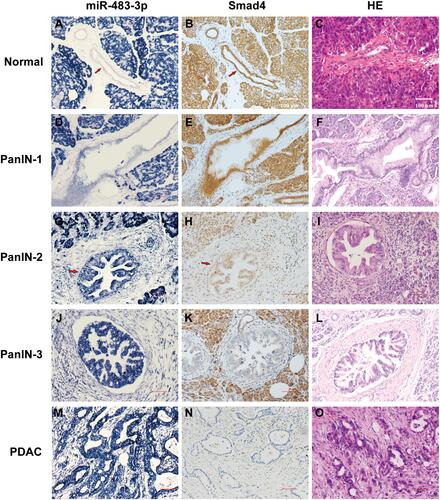
Figure 2 Relative miR-483-3p expression levels by RT-PCR in serum and serum-derived exosomes from 63 PDAC patients and 22 healthy controls. (A) Serum and (B) serum-derived exosomal miR-483-3p levels in PDAC patients compared with those in healthy subjects. Mann–Whitney U-test, ** p<0.0001, * p<0.01. (C) Serum exosomal miR-483-3p levels in grade 1, 2, and 3 PDAC patients. Kruskal–Wallis test was used. (D) Relationship of serum and serum-derived exosomal miR-483-3p levels. Linear regression was used.
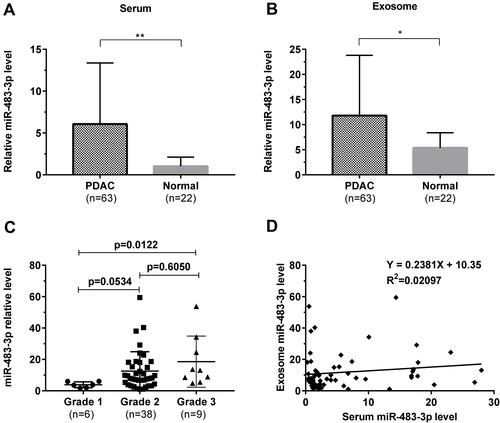
Figure 3 Diagnostic and predicted performance of circulating miR-483-3p levels. (A–E) ROC curve analysis for circulating miR-483-3p levels. (F–G) ROC curve analysis for CA 19–9, CA 19–9 combined with serum miR-483-3p level. PDAC, pancreatic ductal adenocarcinoma; N, normal controls. (H–I) Kaplan–Meier survival analysis in PDAC patients. Log rank test was used.
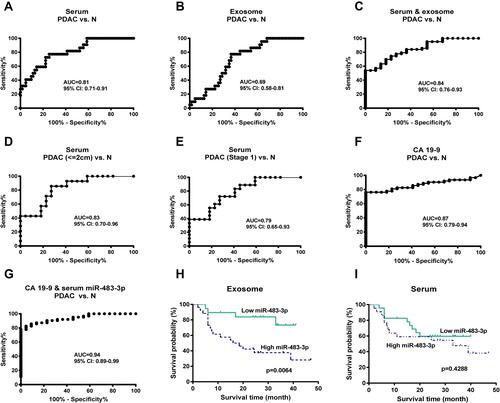
Figure 4 miR-483-3p promotes pancreatic cancer cell migration and invasion in vitro. (A) Transwell migration and invasion assays of PANC1 cells transiently transfected with a miR-483-3p inhibitor (Inhibitor) or negative control (NC), as indicated. (B) Transwell migration and invasion assays of AsPC1 cells transiently transfected with a miR-483-3p mimic (Mimic) or negative control (NC), as indicated. Histograms show the quantification of the cells that traversed the chamber in each assay.
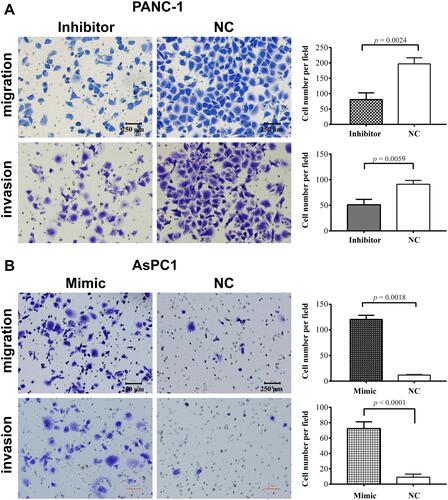
Table 2 Correlation Between Circulating miR-483-3p Expression and Clinicopathologic Characteristics of PDAC Patients
Table 3 Multivariate Analysis of Circulating miR-483-3p Levels and Other Clinicopathologic Factors in PDAC Patients