Figures & data
Table 1 Distribution Proportion of Main Anti-Tumor Effector Cells and PD-L1 in Hepatocellular Carcinoma and Paracancerous Tissues
Figure 1 Flow diagram of tumor infiltrating lymphocytes and PD-L1 in hepatocellular carcinoma. (A) Removal of adhesion of cells by forward angular scattering of FSC-An and FSH-H. (B) CD3 sets up a door to circle out CD3+T cells. (C) Elimination of dead cells by setting a gate through 7AAD. (D and E) Set up a gate to circle the CD4+ cells and CD8+ cells in CD3+T cells. (F and G) Through the control tube of the same type, the PD-L1 positive group was circled.
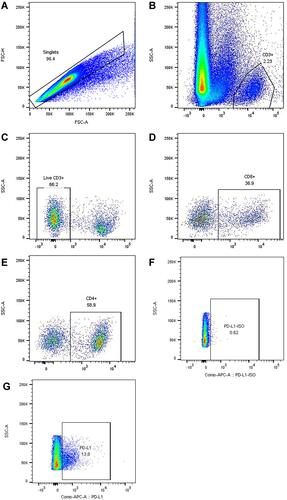
Figure 2 Flow diagram of tumor infiltrating lymphocytes and PD-L1 in paracancerous tissues. (A) Removal of adhesion of cells by forward angular scattering of FSC-An and FSH-H. (B) CD3 sets up a door to circle out CD3+T cells. (C) Elimination of dead cells by setting a gate through 7AAD. (D and E) Set up a gate to circle the CD4+ cells and CD8+ cells in CD3+T cells. (F and G) Through the control tube of the same type, the PD-L1 positive group was circled.
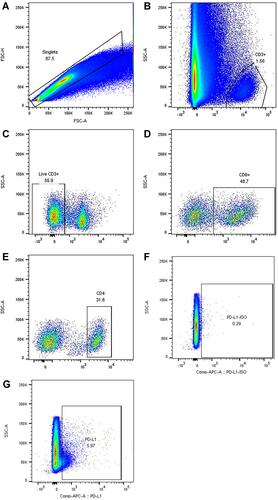
Table 2 Relationship Between the Expression of CD8/CD3 and PD-L1 in Hepatocellular Carcinoma and Clinicopathological Factors
Table 3 Univariate and Multivariate Cox Regression Analysis of Postoperative Prognosis in 72 Patients with Hepatocellular Carcinoma
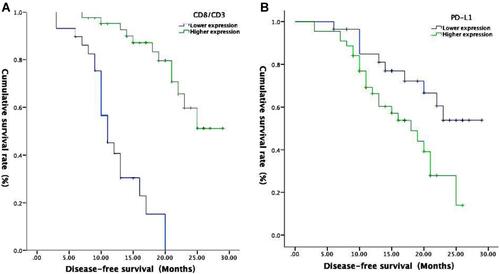
Figure 3 Kaplan–Meier survival analysis curve. (A) CD8/CD3; (B) PD-L1.