
Figures & data
Table 1 Association Between ALDOA Expression and the Clinicopathological Characteristics of Patients with PCa in the Evaluated Cohorts
Figure 1 Flow chart showing the selection of ALDOA.
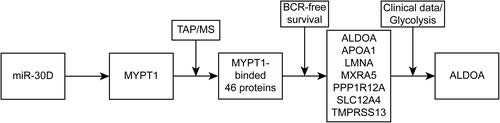
Figure 2 Immunohistochemical staining for ALDOA in PCa and adjacent benign tissues and survival analysis of ALDOA using data extracted from the Taylor database. (A) A full view of the immunohistochemistry staining for ALDOA in the TMA. (B) Immunostaining showing the high and low expression of ALDOA. Magnification on the left panel is ×4. The magnification of the right panel is ×20. (C) Kaplan–Meier curves showed that there was a significant difference in BCR-free survival between patients with high and low expression of ALDOA in the Taylor dataset (P = 0.0161). (D) There was no significant difference in overall survival between the two groups (P = 0.0918).
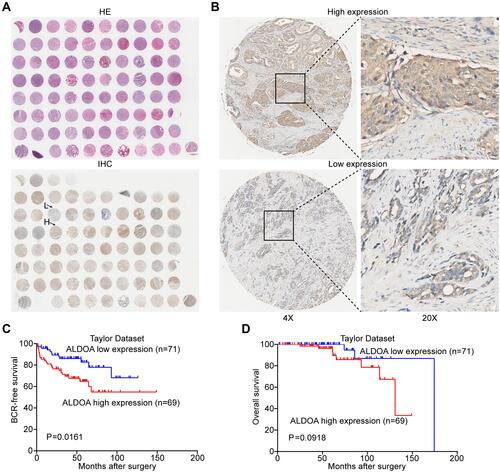
Table 2 Prognostic Value of ALDOA Expression Levels for the Biochemical Recurrence-Free Survival of PCa Patients on Univariate and Multivariate Analyses by Cox Regression Analyses
Figure 3 ALDOA promotes the proliferation of PCa cells, prolongs the cell cycle, and suppresses apoptosis in PC3 and DU145 cell lines. (A) ALDOA levels were verified by Western blotting after transfection. (B) ALDOA overexpression enhanced the proliferation of PC3 and DU145 cells in vitro, while ALDOA knockdown inhibited the proliferative effects. (C, D, E, F) ALDOA overexpression prolonged the cell cycle of PC3 and DU145 cells in vitro, while ALDOA knockdown suppressed the effects on the cell cycle. (G, H, I, J) ALDOA overexpression suppressed apoptosis of PC3 and DU145 cells, while ALDOA knockdown did not induce significant apoptosis. *P < 0.05, **P < 0.01, ***P < 0.001 compared with the NC group.
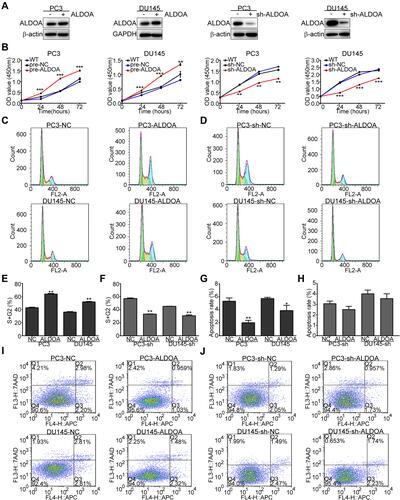
Figure 4 ALDOA promotes the tumor growth of PCa in nude mice in vivo and upregulates the expression of Ki67 and PCNA in the tumor tissues of nude mice. (A and C) Overexpression of ALDOA enhances tumor growth of DU145 and PC3 cells in the nude mice xenograft model. (B and D) Knockdown expression of ALDOA does not significantly inhibit tumor growth of DU145 and PC3 cells in the nude mice xenograft model. (E and F) The immunohistochemistry score for Ki67 and PCNA in tumor tissues resulting from ALDOA overexpression in PC3 and DU145 cell lines. (G and H) The immunohistochemistry score for Ki67 and PCNA in the tumor tissues resulting from ALDOA knockdown in PC3 and DU145 cell lines. Statistical analysis is shown as mean ±SD.*P < 0.05, **P < 0.01, ***P < 0.001 compared with the NC group.
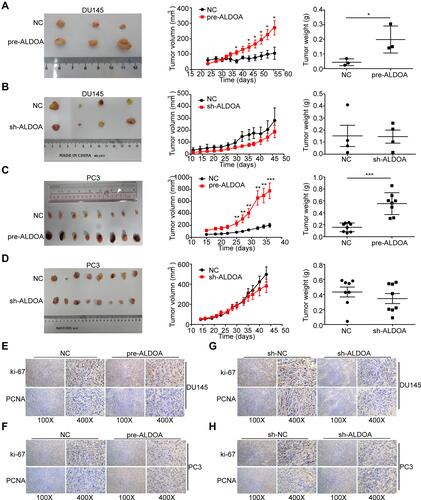
Figure 5 ALDOA expression is negatively correlated with MYPT1 expression in the Taylor prostate cancer dataset. (A and B) Comparison of the overall biochemical recurrence-free survival rate and overall survival rate across different groups stratified according to MYPT1 and ALDOA expression. (C) There was a significant difference in the overall biochemical recurrence-free survival rate between the groups with low MYPT1 expression and high ALDOA expression and the groups with high MYPT1 expression and low ALDOA expression. (D) The expression of ALDOA in the PCa of the Taylor Dataset was negatively correlated with MYPT1 expression. (E) The cell viability of PC3 groups gradually decreased as the concentration of naphthol AS-E phosphate increased. (F) The cell viability of DU145 cells treated with a higher concentration of naphthol AS-E phosphate (10 and 20 μmoL/L) was lower than that of the control group. **P < 0.01 compared with the NC group. (G–H) Molecular docking results of naphthol AS-E phosphate and aldolase A. (G) The association between the higher affinity molecules and the acceptor molecules and hydrophobic and hydrophilic regions is shown in green and pink, respectively. (H) The mode of action between the molecule and the acceptor molecule showing the highest affinity.
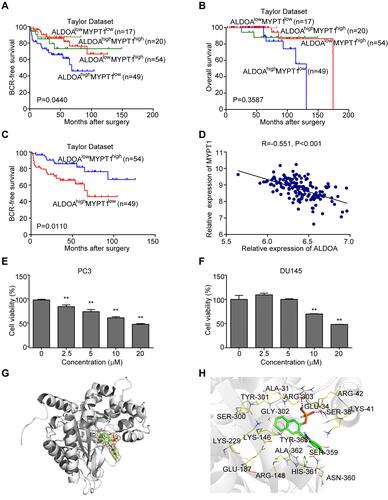
Table 3 Affinity Data Between Ligands and Receptors of 10 Molecular Models Were Obtained by Molecular Docking Simulations Between Naphthol AS-E Phosphate and Aldolase A