Figures & data
Table 1 List of Primer Sets for qRT-PCR
Figure 1 TEAD4 is highly upregulated in UBC. (A and B) TEAD1–4 mRNA expression levels between UBC tissues (T) and their adjacent noncancerous tissues (N) in TCGA-BLCA (A) and GSE13507 (B) datasets. (C) TEAD4 protein levels in 16 paired UBC tissues (T) and their adjacent noncancerous tissues (N) were examined by Western blotting. (D) Endogenous expression of TEAD4 in SV-HUC-1 and multiple UBC cell lines were detected by Western blotting. (E) Representative IHC staining images of the localization and expression of TEAD4 in normal urothelium epithelial and UBC tissues were displayed. Scale bar, 50 and 20μm. **P<0.01, ***P<0.001.
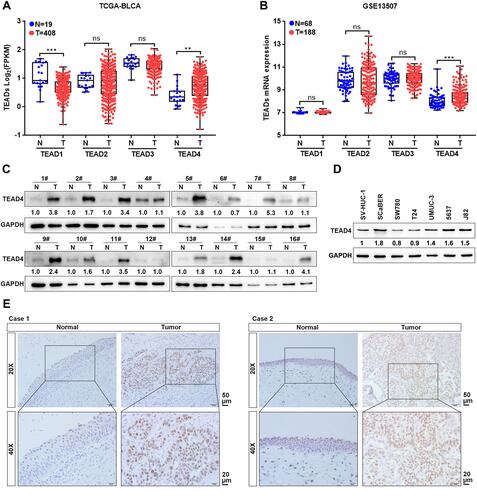
Table 2 The Association Between TEAD4 Protein Levels and Clinicopathological Features of UBC Patients (n=50)
Table 3 Univariate and Multivariate Analyses of Clinicopathological Features and Survival Time of UBC Patients (n=50)
Figure 2 TEAD4 expression is elevated in advanced stage patients with UBC. (A–F) TEAD4 mRNA expression level in different tumor stage phase of UBC samples from TCGA-BLCA (A), GSE13507 (B), GSE31684 (C), GSE32584 (D), GSE32894 (E), and GSE48075 (F) datasets. (G) Representative IHC staining images of the TEAD4 expression in different tumor stage phase of UBC patients were displayed. Scale bar, 50 and 20μm. *P<0.05, **P<0.01, ***P<0.001.
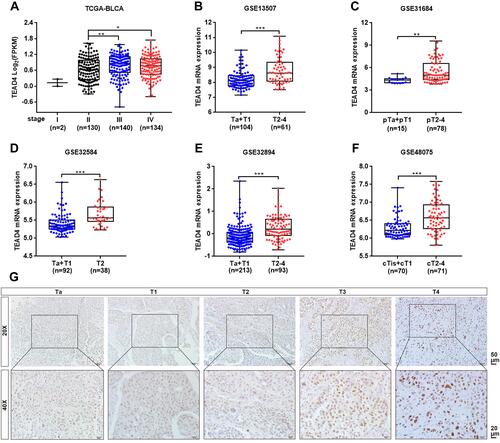
Figure 3 TEAD4 expression is increased in high-grade patients with UBC. (A–E) TEAD4 mRNA expression level in different tumor grade phase of UBC samples from TCGA-BLCA (A), GSE13507 (B), GSE31684 (C), GSE32584 (D), and GSE32894 (E) datasets. (F) Representative IHC staining images of the TEAD4 expression in low grade and high grade of UBC patients were displayed. Scale bar, 50 and 20μm. *P<0.05, ***P<0.001.
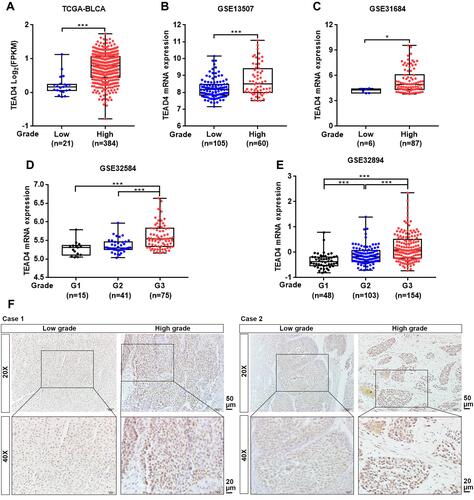
Figure 4 Overexpression of TEAD4 is strongly correlated with poor clinical outcome in patients with UBC. (A–F) Kaplan-Meier survival plots for TEAD4 were constructed according to the data from TCGA-BLCA (A), GSE13507 (B), GSE31684 (C), GSE32894 (D), GSE48075 (E) and our IHC cohort (F).
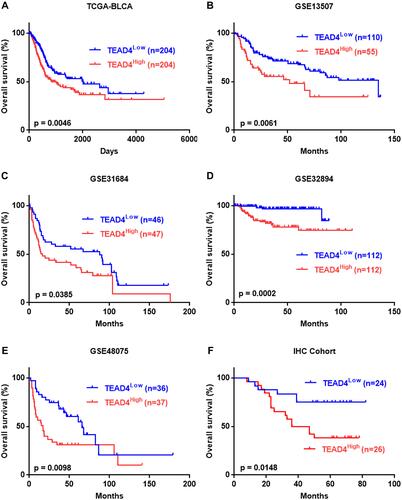
Figure 5 TEAD4 knockdown inhibits UBC cells migration and invasion. (A and B) TEAD4 knockdown in SCaBER and 5637 cell lines were confirmed by qRT-PCR (A) and Western blotting (B) after transfection with siRNAs (siNC, siTEAD4–1, siTEAD4–2). (C–E) Effects of TEAD4 knockdown on migration and invasion abilities of UBC cells were examined by wound healing (C) and transwell (D and E) assays. Scale bar, 200μm (C) and 100μm (D and E). Right, statistical analysis. **P<0.01, ***P<0.001.
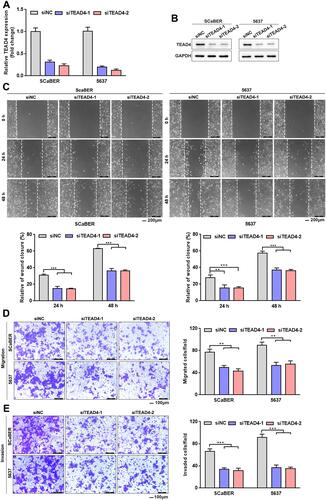
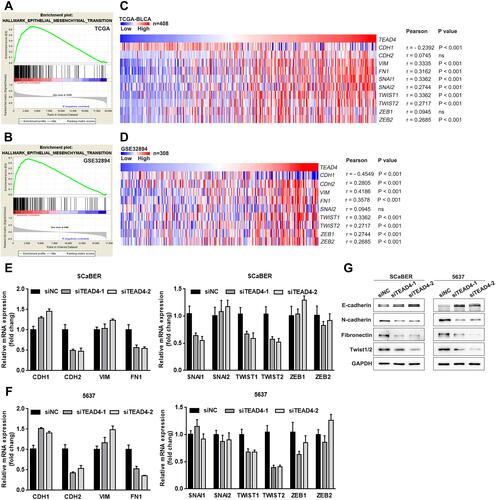
Figure 6 TEAD4 induces UBC cells EMT. (A and B) GSEA results of EMT gene sets for high TEAD4 expression groups in TCGA-BLCA (A) and GSE32894 (B) datasets. (C and D) The Pearson correlation between TEAD4 mRNA expression level and EMT-associated markers and transcription factors mRNA expression level in TCGA-BLCA (C) and GSE32894 (D) datasets was presented with heat map. (E–G) The mRNA and protein expression of EMT-associated markers and transcription factors upon TEAD4 knockdown in SCaBER and 5637 cells were determined by qRT-PCR (E and F) and Western blotting (G), respectively.