Figures & data
Figure 1 Cell morphology in miR-944, anti-miR-944, and corresponding negative control infected HCT116 and SW480 cells with or without EGF (50 ng/mL) treatment. (A and C) BSA treatment, (B and D) EGF treatment. The fibroblastoid-like phenotype in HCT116 (A and B) and SW480 (C and D) weakened miR-944 group cells compared with the scramble group. Anti-miR-944 had the opposite effect.
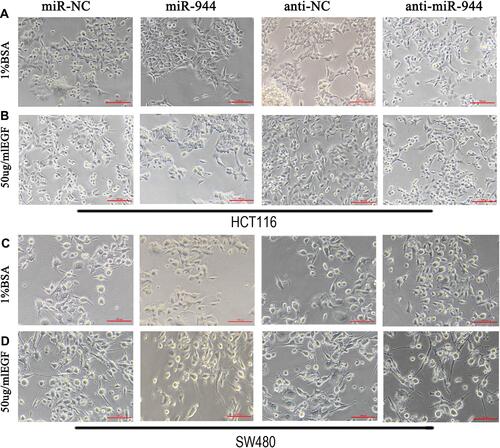
Figure 2 Cell invasion and migration in miR-944, anti-miR-944, and scramble-infected CRC cells with or without EGF treatment. Cell migration (AI and AII) and invasion (AIII and AIV) in miR-944 and anti-miR-944 and scramble infected HCT116 cells with or without EGF (50 ng/mL) treatment. Cell migration (BI and BII) and invasion (BIII and BIV) in miR-944 and anti-miR-944 and scramble-infected SW480 cells with or without EGF (50 ng/mL) treatment. White bars represent cell invasion or migration in the scramble and miR-944 groups with or without EGF treatment. Black bars represent cell invasion or migration in the scramble and anti-miR-944 groups with or without EGF treatment. Bars indicate ± S.E. *P < 0.05; **P < 0.01 compared with control.
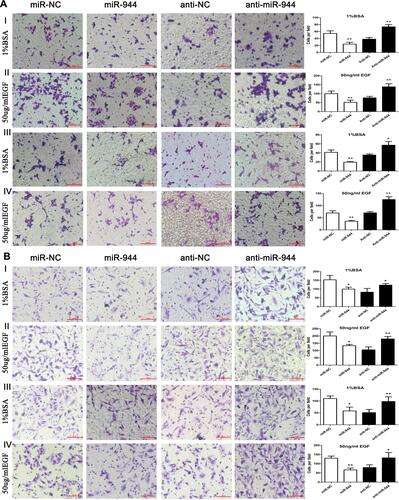
Table 1 Relationship of GATA6 with miR-944, β-Catenin and ZEB1
Figure 3 miR-944 inhibits the EGF-induced EMT and wnt-β-catenin signaling pathway of CRC cells. (A) The KEGG analysis using GSEA comparing genes related to miR-944, GATA6, and miR-944/GATA6 ratio in TCGA. (B) Western blot analysis of GATA6 levels, representing epithelial and wnt-β-catenin markers in HCT116. (C) Nuclear β-catenin change in miR-944, anti-miR-944, and scramble-infected HCT116. (D) Western blot analysis of GATA6 levels, representing epithelial and wnt-β-catenin markers in SW480. (E) Nuclear β-catenin change in miR-944, anti-miR-944, and scramble-infected SW480. White bars indicate target protein expression without EGF treatment, while Black bars indicate target protein expression with EGF treatment. Bars indicate ± S.E.*P<0.05; **P<0.01 compared with control.
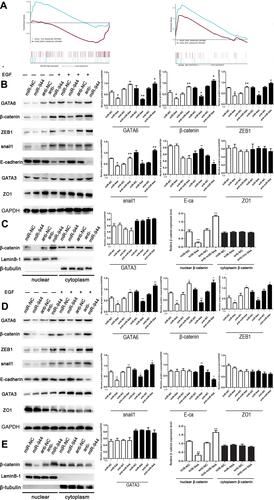
Figure 4 The association between miR-944-GATA6 and wnt-β-catenin signaling pathway in two CRC cell lines and CRC tissues. (A) The co-staining of GATA6 with β-catenin in HCT116 cells and SW480 using a fluorescence microscope. (B) Co-expression of miR-944 with GATA6, β-catenin, and ZEB1 in low miR-944 tissue and high miR-944 tissue using Immunohistochemistry. (C) β-catenin co‐immunoprecipitated with GATA6 in HCT 116 and SW480 cells. The input and IgG lanes were used as the positive and negative controls, respectively. (D) Co-expression analysis showing a positive relationship between GATA6 and β-catenin, β-catenin and ZEB1 in TCGA_COAD dataset by GEPIA, (E) the diagram illustrating how miR-944 decreased the EMT by inhibiting the GATA6 mediated Wnt/β-catenin signaling pathway activity n = 3.
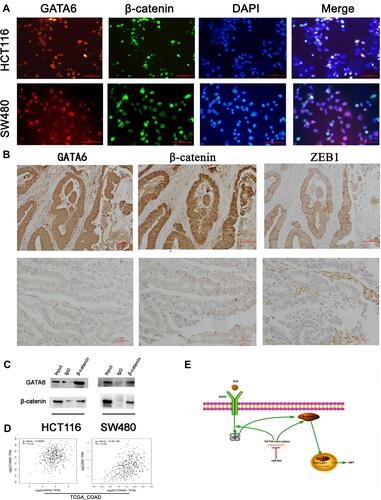
Figure 5 Cell invasion and migration in rescue experiment. GATA6 knockdown reversed cell migration and invasion functions caused by the silencing miR‐944 with or without EGF (50 ng/mL) treatment. (A) Cell migration and invasion assays in Human colon cancer cells‐116 (HCT116) cells, and (B) Cell migration and invasion assays in SW480 cells, n = 3, *P < 0.05 and **P < 0.01 using t-test.
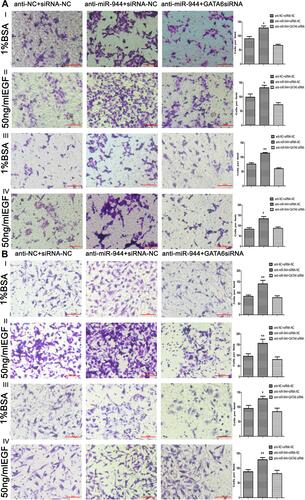
Figure 6 GATA6, β-catenin, and ZEB1 protein changes in rescue experiment. Knockdown reversed the increased GATA6, β-catenin, and ZEB1 expression levels induced by the miR‐944 inhibitor with or without EGF (50 ng/mL) treatment. (A) GATA6 antisense experiments in Human colon cancer cells‐116 (HCT116) cells, and (B) GATA6 antisense experiments in SW480 cells, n = 3, *P < 0.05 and **P < 0.01 using t-test.
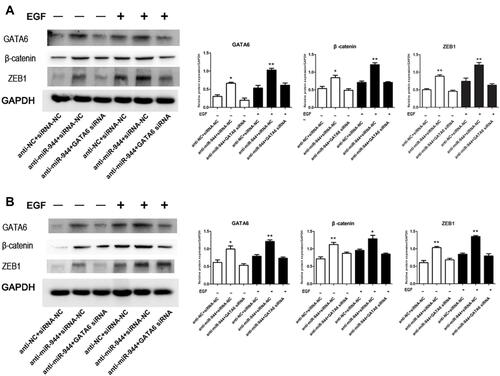
Table 2 Association of miR-944 Expression Levels with Clinical Data
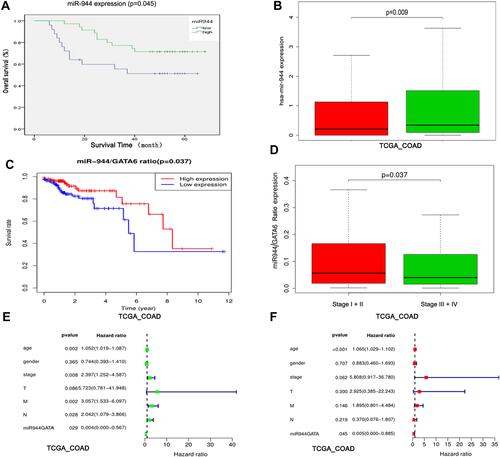
Figure 7 Identification of the miR-944 and miR-944/GATA6 ratio as a CRC prognosis marker. (A) High and low miR-944 expressions plotted against overall survival time in 60 CRC patients. (B) Chi-square analysis of the relationship between the miR-944 and clinical stage in TCGA data. (C) High and low miR-944/GATA6 expression ratio plotted against overall survival time in TCGA. (D) Chi-square analysis of the relationship between the miR-944/GATA6 ratio and clinical stage in TCGA data. (E) Univariate Cox regression analysis of the relationship between the miR-944/GATA6 ratio and prognosis in TCGA. (F) multivariate Cox regression analysis of the relationship between the miR-944/GATA6 ratio and prognosis in TCGA.