Figures & data
Table 1 The Primers Used in the Study
Figure 1 The correlation between RAET1K and miR-503-5p in AML. (A and B) The expression levels of RAET1K (A) and miR-503-5p (B) in bone marrows of AML patients (n = 35) and healthy controls (n = 30) were detected by qRT-PCR. (C) The correlation between the expression of RAET1K and miR-503-5p in AML patients was analyzed by Pearson correlation analysis (n = 35). (D and E) The expression levels of RAET1K (D) and miR-503-5p (E) in leukemia cell lines (HL-60 and THP-1) and normal HS cells were detected by qRT-PCR. (F) The overall survival of AMI patients with high or low levels of RAET1K was evaluated by Kaplan-Meier survival curve. Each experiment was repeated three times. **P < 0.01.
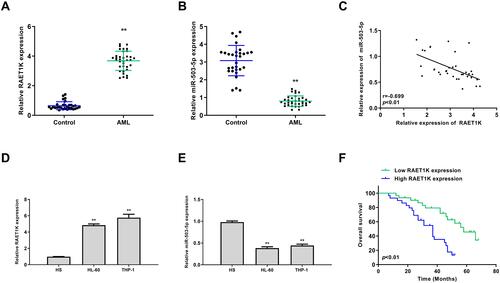
Figure 2 Silencing of RAET1K inhibited proliferation, invasion, migration and promoted apoptosis of leukemia cells in vitro. HL-60 and THP-1 cells were transfected with si-RAET1K or si-NC. (A) The transfection efficiency was evaluated by qRT-PCR. (B and C) Cell proliferation was measured by CCK-8 assay (B) and EdU staining assay (C). (D) Cell apoptosis was detected by flow cytometry. (E and F) Cell migration (E) and invasion (F) were evaluated by transwell assay. Each experiment was repeated three times. **P < 0.01, ***P < 0.001.
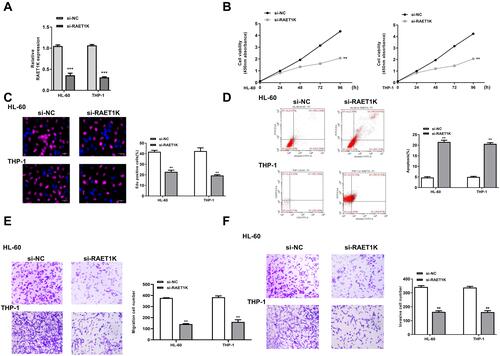
Figure 3 Overexpression of miR-503-5p inhibited proliferation, invasion, migration and promoted apoptosis of leukemia cells in vitro. HL-60 and THP-1 cells were transfected with miR-503-5p mimics or miR-NC. (A) The transfection efficiency was evaluated by qRT-PCR. (B and C) Cell proliferation was measured by CCK-8 assay (B) and EdU staining assay (C). (D) Cell apoptosis was detected by flow cytometry. (E and F) Cell migration (E) and invasion (F) were evaluated by transwell assay. Each experiment was repeated three times. **P < 0.01, ***P < 0.001.
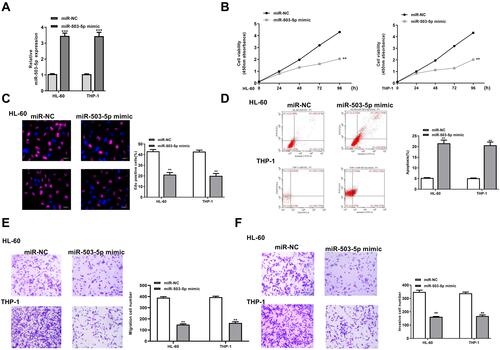
Figure 4 RAET1K was a sponge of miR-503-5p. (A) The putative binding site between RAET1K and miR-503-5p was predicted by Starbase. (B) The relative luciferase reporter activity of WT or MUT RAET1K was detected by a dual-luciferase reporter system. (C) RIP assay was performed by using anti-Ago2 antibody. (D) HL-60 and THP-1 cells were transfected with si-RAET1K or si-NC, and the mRNA level of miR-503-5p was detected by qRT-PCR. (E) HL-60 and THP-1 cell were transfected with pc- RAET1K or pc-NC, and the mRNA level of miR-503-5p was detected by qRT-PCR. Each experiment was repeated three times. **P < 0.01.
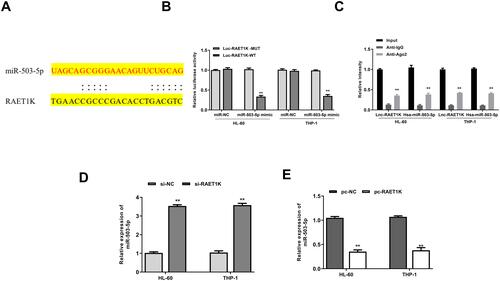
Figure 5 Downregulation of miR-503-5p reversed si-RAET1K induced protective role in AMI progression in vitro. HL-60 and THP-1 cells were transfected with si-NC, si-RAET1K, miR-503-5p inhibitor or co-transfected with si-RAET1K and miR-503-5p inhibitor. (A and B) Cell proliferation was measured by CCK-8 assay (A) and EdU staining assay (B). (C) Cell apoptosis was detected by flow cytometry. (D and E) Cell migration (D) and invasion (E) were evaluated by transwell assay. Each experiment was repeated three times. *P < 0.05, **P < 0.01 vs si-NC group; #P < 0.05 vs si-RAET1K group.
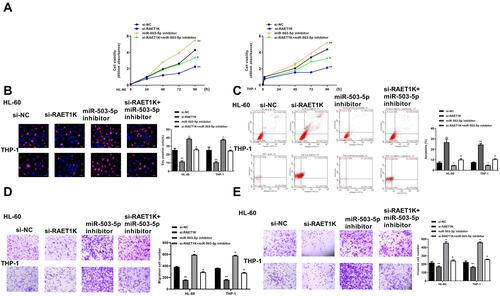
Figure 6 INPP4B was a target of miR-503-5p. (A) The putative binding site between miR-503-5p and INPP4B was predicted by Targetscan. (B) The relative luciferase reporter activity of WT or MUT INPP4B was detected by a dual-luciferase reporter system. (C and D) HL-60 and THP-1 cells were transfected with miR-NC, miR-503-5p mimics, inhibitor NC, or miR-503-5p inhibitor. (C) The mRNA level of INPP4B was detected by qRT-PCR. (D) The protein level of INPP4B was detected by Western blot. (E) HL-60 and THP-1 cells were transfected with si-RAET1K or si-NC, and the mRNA level of INPP4B was detected by qRT-PCR. (F) The mRNA expression of INPP4B in bone marrows of AML patients (n = 35) and healthy controls (n = 30) were detected by qRT-PCR. (G) The correlation between the expression of miR-503-5p and IMPP4B was analyzed by Pearson correlation analysis (n = 35). Each experiment was repeated three times. **P < 0.01.
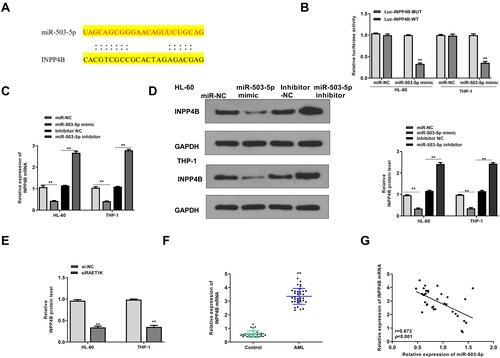
Figure 7 Overexpression of INPP4B reversed miR-503-5p mimics induced protective role in AMI progression in vitro. (A) HL-60 and THP-1 cells were transfected pcDNA-INPP4B (overexpression of INPP4B) or negative control pcDNA-NC, and the expression of INPP4B was detected by qRT-PCR. (B–F) HL-60 and THP-1 cells were transfected with miR-503-5p mimics, miR-NC, or co-transfected with miR-503-5p mimics and pcDNA-INPP4B. (B and C) Cell proliferation was measured by CCK-8 assay (B) and EdU staining assay (C). (D) Cell apoptosis was detected by flow cytometry. (E and F) Cell migration (E) and invasion (F) were evaluated by transwell assay. Each experiment was repeated three times. **P < 0.01 vs miR-NC group; #P < 0.05, ##P < 0.01 vs miR-503-5p mimics group.
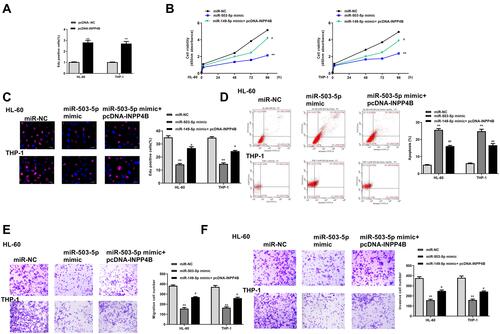
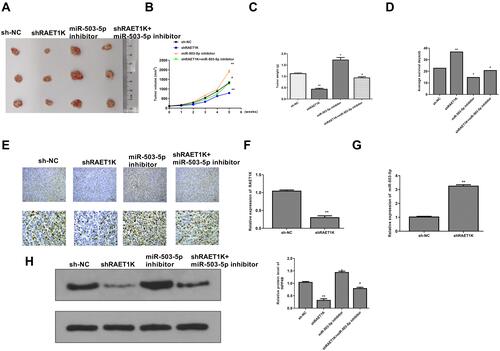
Figure 8 Downregulation of RAET1K suppressed the tumorigenesis of leukemia cells through regulating miR-503-5p/INPP4B axis in vivo. (A) The representative images of subcutaneous tumor from different groups. (B) Tumor weight was evaluated on the 35th day. (C) Tumor volume was evaluated every 1 week for 5 weeks. (D) The average survival time of mice in four groups. (E) Ki-67 staining assay. (F and G) The expression of RAET1K (F) and miR-503-5p (G) in tumor tissues of sh-RAET1K group and sh-NC group were detected by qRT-PCR. (H) The expression of INPP4B in tumor tissues from different groups was evaluated by Western blot. n = 8 in each group. n = 8 in each group. Each experiment was repeated three times. *P < 0.05, **P < 0.01 vs sh-NC group; #P < 0.05 vs sh-RAET1K group.