
Figures & data
Table 1 Baseline Demographics and Clinical Characteristics
Table 2 Crizotinib and Pazopanib Dose-Escalation Schedule (21-Day Cycle), Grade 3/4 Toxicities and Response
Figure 1 Waterfall plot depicting best RECISTv1.1 response. Individual patients are represented by vertical bars on the X-axis and best RECISTv1.1 response is depicted as percentage on the Y-axis. Sixty one of 82 patients had at least one post-baseline scan and were evaluable for response. Two patients were marked as progressive disease even though their percentage of tumor increase was less than 20% because of new lesions (*). Dotted lines show 20% increase and 30% decrease in tumor size by RECISTv1.1.
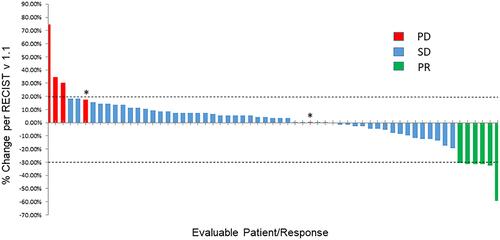
Table 3 Adverse Events at Any Dose Level
Table 4 Stable Disease (SD) ≥6 Months or Partial Response (PR) by RECIST and Characterization by Patient