Figures & data
Table 1 Clinico-Pathological Characteristics of the Assessed Colorectal Cancer Patients (n=100)
Figure 1 (A) The expression levels of MSI-high, MSI-low and MSS in colorectal cancer patients, (B) the mean count of CTCs in CRC patients before and after treatment, (C) the expression levels of CTCs (baseline, post-treatment, and serial CTCs change) in the patients.
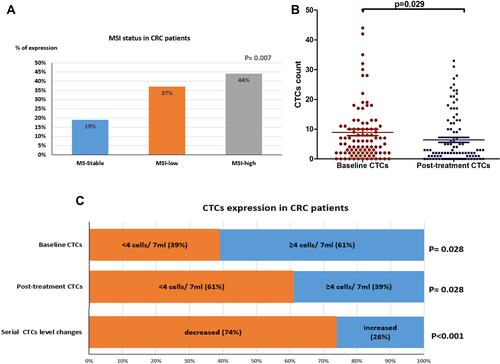
Table 2 Association Between MSI and the Clinico-Pathological Features of the CRC Patients
Table 3 Association Between the Baseline CTCs and Clinic-Pathological Features in CRC Patients
Table 4 Association Between Serial CTCs Level Changes and the Clinicopathological Features of the CRC Patients
Figure 2 Association between PFS and (A) baseline CTCs count, (B) serial CTCs change, (C) post-treatment CTCs count. Association between OS and (D) baseline CTCs count, (E) serial CTCs change, (F) post-treatment CTCs count.
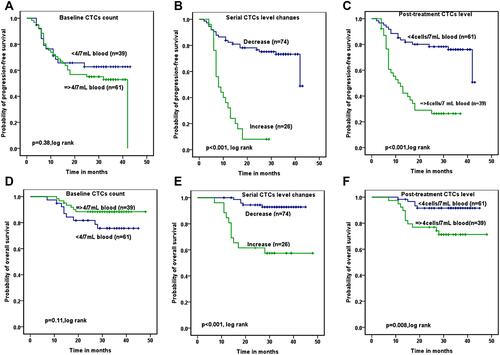
Figure 3 The impact of MSI levels in all CRC patients on (A) PFS and (B) OS rates. The impact of MSI levels in early-stage CRC patients on (C) PFS and (D) OS rates. The impact of MSI levels in late-stage CRC patients on (E) PFS and (F) OS rates.
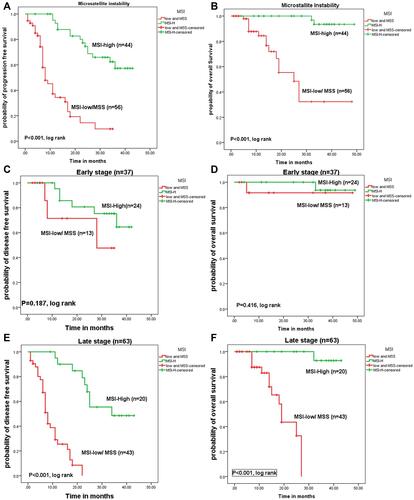
Table 5 Univariate and Multivariate Survival Analysis for the Assessed CRC Patients
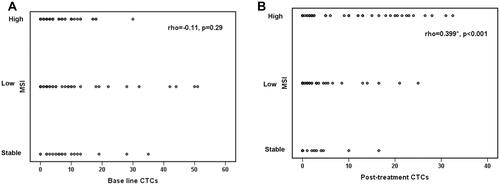
Figure 4 Correlation between MSI and CTCs count (Baseline and post-treatment). (A) Non-significant negative correlation between MSI-high and increase in number of base line CTCs (rho=−0.11, p=0.29). (B) shows significant positive correlation between MSI-high and increase in number of post-treatment CTCs (rho=0.399, p<0.001).