
Figures & data
Table 1 Baseline Clinicopathological Data of Patients with HNSCC and Expression of p53 and TLR9 in Relation to HPV and p16 Status
Figure 1 Representative ISH and IHC images. (A) HPV ISH–positive HNSCC; (B) HPV ISH–negative HNSCC; (C) p16-positive HNSCC; (D) p16-negative HNSCC; (E) p53-positive HNSCC; (F) p53-negative HNSCC; (G) TLR9-positive HNSCC; and (H) TLR9-negative HNSCC. Scale bar: 20 μm; magnification ×400.
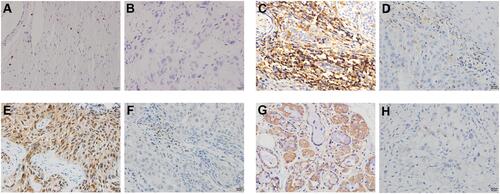
Table 2 Associations Between p16, p53, and TLR9 Protein Expression and HPV Status
Table 3 Univariate and Multivariate Cox Regression Analyses of OS Among the 85 Patients with HNSCC
Figure 2 Kaplan–Meier curve analysis of OS and DFS. (A) HPV status, (B) p16 expression, (C) p53 expression, (D) TLR9 expression, (E and F) two-marker signatures high p16/low p53 and high p16/low TLR9, and (G) three-marker signature high p16/low p53/low TLR9 were compared using categorical data analysis, and OS and DFS were estimated by the Kaplan–Meier method.
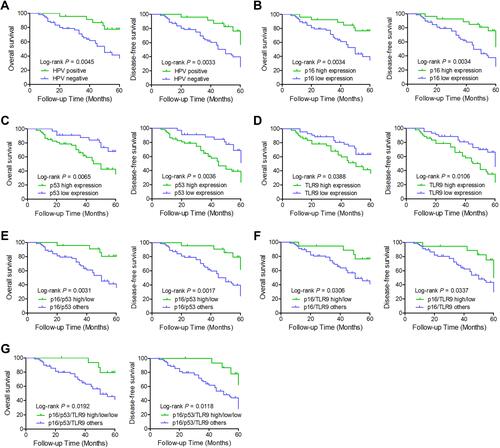
Table 4 Univariate and Multivariate Cox Regression Analyses of DFS Among the 85 Patients with HNSCC