Figures & data
Figure 1 IFNγ induced a higher intensity of PD-L1 expression in MSI cell lines. To investigate whether IFNγ responsiveness is related to MSI status, we evaluated the expression of PD-L1 in different cell lines induced by IFNγ via RT-qPCR, Western blot and FCM. (A and B) PD-L1 expression was measured by flow cytometry in MSI (the upper line: HCT116, LOVO and HCT15) and MSS (the lower line: SW480, SW620 and SW1116) cell lines 12 h after treatment with 100 IU/mL IFNγ. DMSO was used as a negative control (*P < 0.05). (C) PD-L1 mRNA relative expression induced by IFNγ (100 IU/mL IFNγ for 12 h) was measured by qPCR (*P < 0.05). (D) Expression levels of the PD-L1 protein stimulated with 100 IU/mL IFNγ for 12 h.
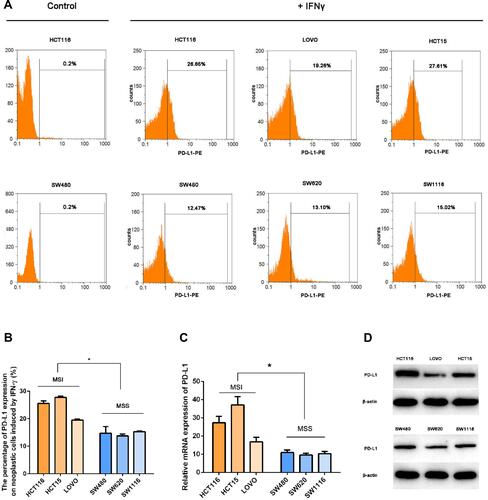
Figure 2 Effects of IFNγ and kinase inhibitors on PD-L1 expression in the MSI and MSS cell lines. (A–C) PD-L1 expression was measured by flow cytometry in HCT15 (the upper line) and SW620 (the lower line) cell lines 12 h after treatment with 100 IU/mL IFNγ, with 1 μmol/L wortmannin (AKT inhibitor), 50 μmol/L PD98059 (ERK1/2 inhibitor), or 50 μmol/L fludara (STAT1 inhibitor). DMSO was used as a vehicle and negative control (*P < 0.05 vs cells treated with IFNγ and DMSO). (D) Expression levels of STAT1, p-STAT1, STAT3 and p-STAT3 in MSI cell lines (HCT116 and HCT15) as well as MSS cell lines (SW480 and SW620) with 100 IU/mL IFNγ for 15 min and 12 h, respectively.
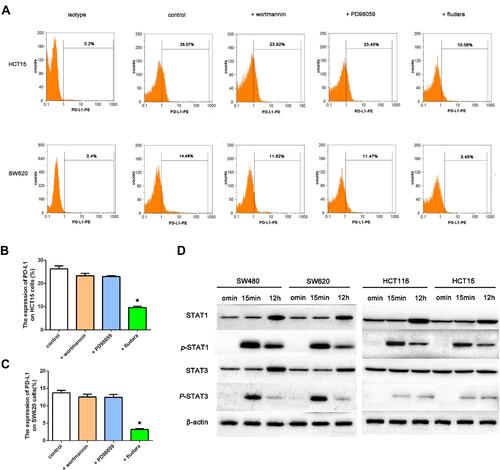
Figure 3 PD-L1 expression influenced neoplastic cells in response to PD-1 blockade. To investigate whether PD-L1 expression influences the response of PD-1 blockade immunotherapy in vitro, we performed two different profiles with higher PD-L1 expression in a coculture assay: PD-L1 transduced CT26 cell challenge (a higher extent of PD-L1 expression) and HCT116 enrolled (a lower degree of PD-L1 expression). (A) Cell apoptosis shown by TUNEL staining (×40, scale bar is 20 μm) in the four coculture assays. Shown by fluorescence microscopy, red indicates apoptotic cells stained by TUNEL, and blue indicates nuclei stained by DAPI. The number of TUNEL-positive cells (red color) and total number of cells (blue color) were captured with a fluorescence microscope. The rate of cell apoptosis was measured by the number of red cells divided by the number of blue cells. The apoptotic rate was (26.00±3.61)% in group 1 (CT26+PBMC), (12.33±3.21)% in group 3 (PD-L1 transduced CT26+PBMC), (90.33±2.52)% in group 2 (CT26+PBMC+PD-1), and (92.00±2.65)% in group 4 (PD-L1 transduced CT26+PBMC+PD-1). The apoptosis rate of group 3 was significantly decreased compared with that of group 1 (p=0.001). PD-1 blockade significantly induced an increased apoptosis rate in CT26-challenged (p=0.003), or PD-L1-transduced CT26 cell-exposed (p=0.000). No significant difference was observed among the two PD-1 blockade groups. (B and C) Effect of PD-1 blockade on viability of CT26, PD-L1 transduced CT26, SW480 and HCT116 cells. Cells were treated with IFNγ plus PD-1 blockade for 12 hours. Cell proliferation viability was measured using Cell Counting Kit-8 assay. Data represented as mean ± SE of three independent experiments made in three replicates (*P < 0.05, **P < 0.001). (D) Effect of PD-1 blockade on PD-L1 expression of CT26, PD-L1 transduced CT26, SW480 and HCT116 cells. Cells were treated with IFNγ plus PD-1 blockade for 12 hours. PD-L1 expression of cancer cells was measured using flow cytometry (*P < 0.05, **P < 0.001).
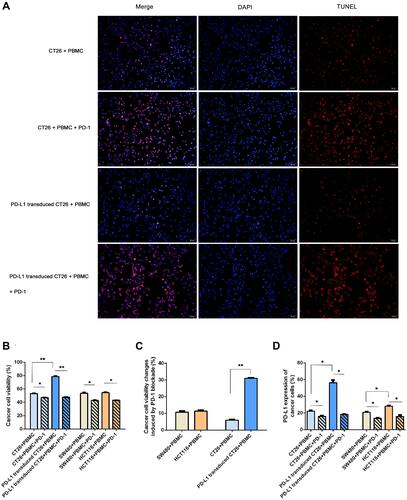
Figure 4 PD-L1 overexpression on CT26 cells influenced PD-L1 expression on CD4+/CD8+ lymphocytes and PD-1 blockade induced changes in CD4+/CD8+ cell counts. Analysis of PD-L1 expression on lymphocytes in a coculture assay and CD4+/CD8+ T cells by flow cytometry. (A) After 12 h following activation in the presence of 100 IU/mL IFNγ in the two coculture assays, the mononuclear cells were collected and PD-L1 expression was assessed by flow cytometry (the left column). CD4 and CD8 expression was, respectively, detected in the two coculture assays treated with IFNγ plus PD-1 blockade for 12 hours (the right column). One representative sample of three is shown. (B) The frequency of CD4+PD-L1+ and CD8+PD-L1+ T cells, and the frequency of CD4+CD3+ and CD8+CD3+ T cells (C) in different coculture assays was statistical analyzed (*P < 0.05).
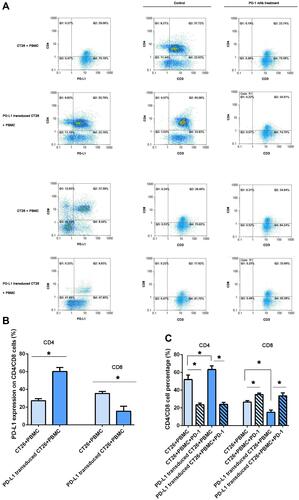
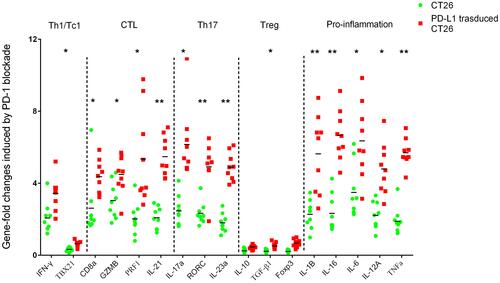
Figure 5 Immune-related gene expression profiles were assessed using RT-qPCR for selected genes. Sets of genes were defined by functional relevance: CD4, Th1/Tc1, CTL, Th17, Treg and pro-inflammation related gene. To analyze the different responses to PD-1 blockade in a coculture assay with CT26 enrolled (the legend is “CT26”, blue) or PD-L1 overexpressing CT26 challenged (the legend is “PD-L1 transduced CT26”, red), we calculated the fold change in gene expression using the 2−ΔΔCt method. *Indicates statistically significant differences, p<0.05; **indicates p<0.001.