Figures & data
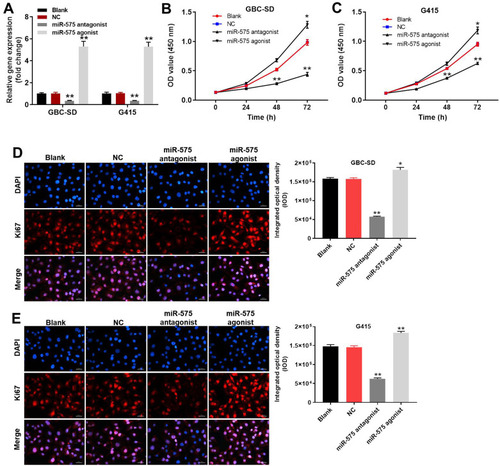
Figure 1 Downregulation of miR-575 significantly upregulated the proliferation of GBC cells. GBC-SD or G415 cells were transfected with miR-575 agonist, miR-575 antagonist, negative control (NC) or nothing (Blank) for 24 h. (A) The expression of miR-575 in GBC-SD or G415 cells was detected by using qRT-PCR. (B) After 0, 24, 48, or 72 h of incubation, the OD value of GBC-SD cells was determined using CCK-8 assay. (C) After 0, 24, 48, or 72 h of incubation, the OD value of G415 cells was determined using CCK-8 assay. (D) After 48 h of incubation, the expression of Ki-67 in GBC-SD cells was detected by immunofluorescence staining. The expression of Ki-67 in GBC-SD cells was quantified by integrated optical density (IOD). (E) After 48 h of incubation, the expression of Ki-67 in G415 cells was detected by immunofluorescence staining. The expression of Ki-67 in G415 cells was quantified by integrated optical density (IOD). Each group were performed at least three independent experiments. *P<0.01 vs control group; **P<0.01 vs control group.