Figures & data
Figure 1 Expression of SLC41A3 mRNA in HCC and normal tissues. (A) The expression of SLC41A3 mRNA in various cancers based on the TCGA database (UALCAN). (B–E) Box plot showing SLC41A3 mRNA levels in the Roessler Liver, Roessler Liver 2, Wurmbach Liver, and Mas Liver datasets, respectively (Oncomine). (F) Comparison of SLC41A3 mRNA level across 4 analyses showed a significant difference between HCC and normal tissues.
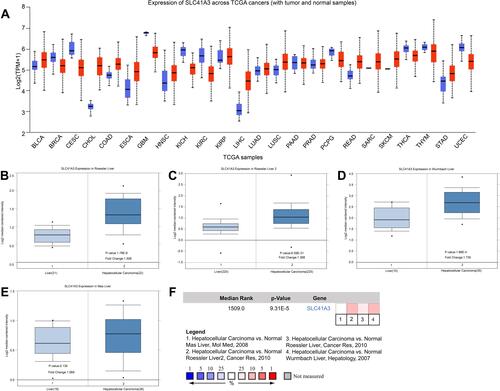
Figure 2 SLC41A3 transcription in subgroups of HCC patients stratified by grade, stage, and other criteria (UALCAN). (A) Boxplot showing relative expression of SLC41A3 in HCC and normal tissue samples. (B–D) Association between SLC41A3 expression and histological grade of HCC (B), TNM stage of HCC (C), and nodal metastasis status of HCC (D). Data are mean ± SE. *P<0.05; **P<0.01; ***P<0. 001.
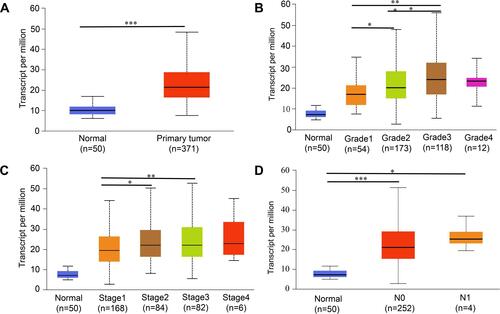
Table 1 Expression of SLC41A3 in Hepatocellular Carcinoma Tissues (n=323)
Figure 3 Immunohistochemical staining of SLC41A3 in HCC and normal tissues. (A) High level of SLC41A3 expression in HCC. (B) Low level of SLC41A3 expression in HCC. (C) Immunohistochemical staining of SLC41A3 in normal hepatic tissue. Original magnification: ×40 (left column) and ×200 (right column).
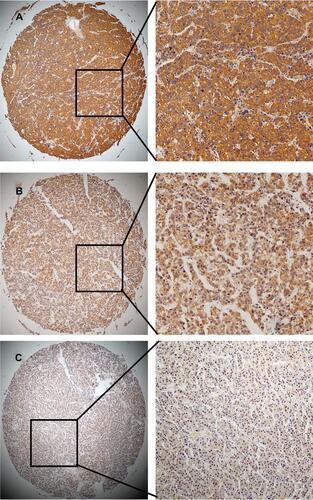
Table 2 Univariate and Multivariate Cox Regression Survival Analysis of Clinicopathological Parameters and SLC41A3 Expression in Hepatocellular Carcinoma Patients
Figure 4 Survival analysis in HCC patients with high or low SLC41A3 expression. (A) High expression of SLC41A3 is associated with poor survival (Kaplan–Meier Plotter database). (B) Kaplan–Meier survival curves of HCC patients recruited in the present study with high or low SLC41A3 expression show that the higher was the expression of SLC41A3 in cancer tissues, the lower was the survival rate.
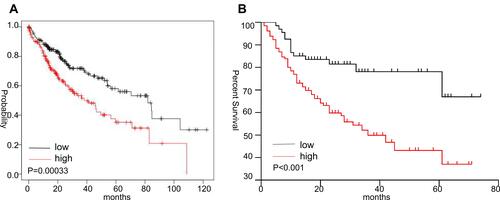
Figure 5 Genes co-expressed with SLC41A3 in HCC (LinkedOmics). (A) Pearson’s test was used to analyze correlations between SLC41A3 and genes differentially expressed in HCC. (B and C) Heat maps showing the top 50 genes positively and negatively correlated with SLC41A3 in HCC. Red indicates positively correlated genes, and green indicates negatively correlated genes. (D–F) The positive correlation between SLC41A3 and the top three genes (ELOVL1, HDAC11, and NEU1). (G–I) The negative correlation between SLC41A3 and the top three genes (CYP4V2, SOCS2, and USP38).
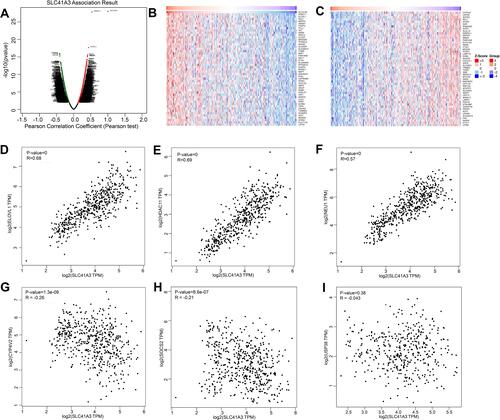
Figure 6 Significantly enriched GO annotations and KEGG pathways of SLC41A3 in HCC (LinkedOmics). The significantly enriched GO annotations and KEGG pathways of genes co-expressed with SLC41A3 in HCC were analyzed using gene set enrichment analysis. (A) Cellular components. (B) Biological processes. (C) Molecular functions. (D) KEGG pathway analysis. The x-axis represents the normalized enrichment score, and the y-axis represents the term of GO.
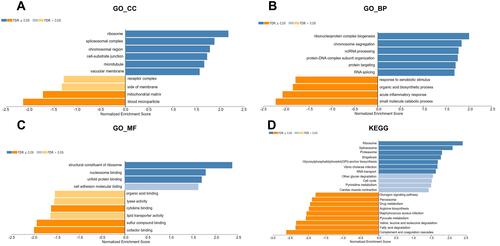
Table 3 Gene Sets Enriched in High SLC41A3 Expression Phenotype in HCC
Figure 7 GSEA reveals potential signaling pathways of SLC41A3. The analysis showed that the cell cycle (A), apoptosis (B), mTOR signaling pathway (C), pathways in cancer (D), TGF-β signaling pathway (E), and WNT signaling pathway (F) were enriched in the SLC41A3 high-expression group. The top panels indicate the enrichment scores for each gene, while the bottom panels show the ranking metrics of each gene. Y-axis: ranking metric values; X-axis: ranks for all genes.
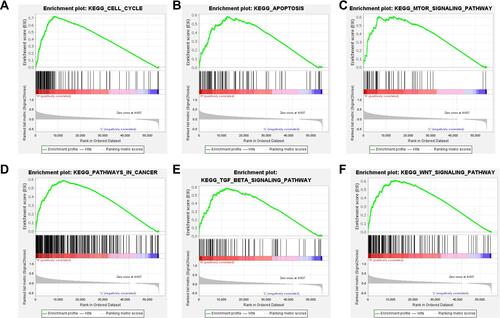
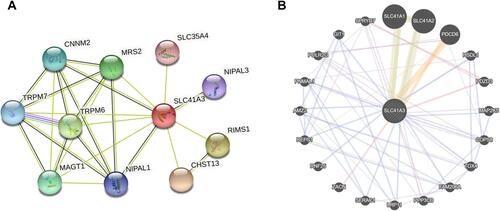
Figure 8 Protein–protein interaction network of SLC41A3. Interactions between SLC41A3 and other genes were obtained from the web portals STRING (A) and GeneMANIA (B).