Figures & data
Figure 1 Characterization of irradiation-resistant lung cancer cells. (A) The proliferation activity of A549/IR cell, XWLC-05/IR cell, A549 cell and XWLC-05 cell was measured by MTT assay. *p < 0.05, **p < 0.01. (B) Cell viability of A549/IR cell, XWLC-05/IR cell, A549 cell and XWLC-05 cell was detected with clone formation assay. (C) Apoptosis rate of A549/IR cell, XWLC-05/IR cell, A549 cell and XWLC-05 cell was measured by flow cytometry. ***p < 0.001. Dates were presented as mean ± SD, the P value was determined by two-tailed t-test and one-way ANOVA.
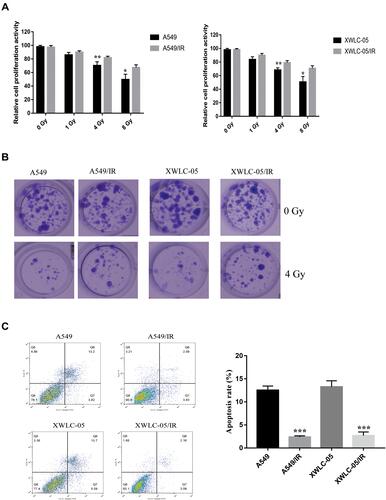
Figure 2 G9a contributes irradiation resistance of lung cancer cells. (A) Expression of G9a and H3K9me3 in A549/IR cell, XWLC-05/IR cell, A549 cell and XWLC-05 cell. Protein quantitative analysis was achieved by Image J. *p < 0.05. (B) Expression of G9a and H3K9me3 in shG9a transfected A549/IR cell and XWLC-05/IR cell. Protein quantitative analysis was achieved by Image J. *p < 0.05, **p < 0.01. (C) The proliferation activity of shG9a transfected A549/IR cell and XWLC-05/IR cell was measured by MTT assay. **p < 0.01. (D) Clone formation of shG9a transfected A549/IR cell and XWLC-05/IR cell after administrated to 0Gy and 4Gy. (E) Apoptosis rate of shG9a transfected A549/IR cell and XWLC-05/IR cell after administrated to 0Gy and 4Gy was measured by flow cytometry. ***p < 0.001. Dates were presented as mean ± SD, the P value was determined by two-tailed t-test and one-way ANOVA.
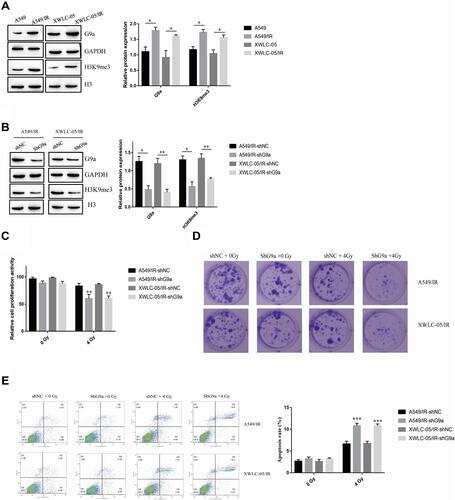
Figure 3 CCDC8 is a downstream target of G9a. (A) Expression of CCDC8 in A549/IR cell, XWLC-05/IR cell, A549 cell and XWLC-05 cell was determined by Western blot assay. Protein quantitative analysis was achieved by Image J. **p < 0.01, ***p < 0.001. (B) Protein expression of CCDC8 in shG9a transfected A549/IR cell and XWLC-05/IR cell was determined by Western blot assay. Protein quantitative analysis was achieved by Image J. *p < 0.05, **p < 0.01. (C) Enrichment of H3K9me3 on CCDC8 promoter was determined buy ChIP assay. *p < 0.05. Dates were presented as mean ± SD, the P value was determined by two-tailed t-test and one-way ANOVA.
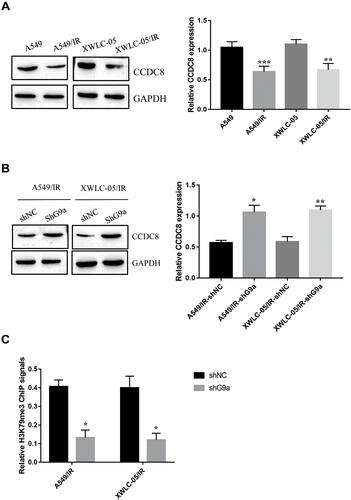
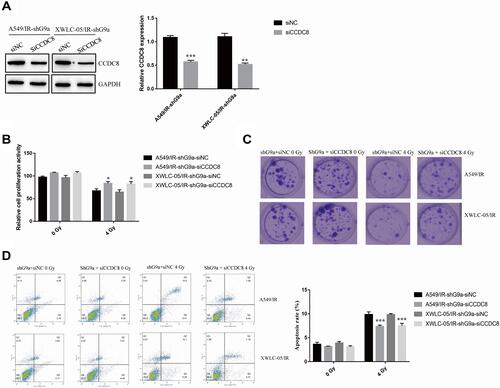
Figure 4 G9a and H3K9me3 modulates lung cancer cells resistance to radiotherapy via modulating CCDC8. (A) Expression of CCDC8 in A549/IR cell and XWLC-05/IR cell transfected with shG9a was measured by Western blot assay. Protein quantitative analysis was achieved by Image J. **p < 0.01, ***p < 0.001. (B) The proliferation activity of siCCDC8 or siNC transfected shG9a-A549/IR cell and shG9a-XWLC-05/IR cell was determined by MTT assay. *p < 0.05. (C) Clone formation of siCCDC8 or siNC transfected shG9a-A549/IR cell and shG9a-XWLC-05/IR cell cell after administrated to 0Gy and 4Gy. (D) Apoptosis rate of siCCDC8 or siNC transfected shG9a-A549/IR cell and shG9a-XWLC-05/IR cell was measured by flow cytometry. ***p < 0.001. Dates were presented as mean ± SD, the P value was determined by two-tailed t-test and one-way ANOVA.