Figures & data
Table 1 Clinicopathological Characteristics of Patients with PTC
Table 2 Multivariate Survival Analysis of Risk Factors for Lymph Node Metastasis of PTC
Figure 1 Low expression of XBP1s is closely related to lymph node metastasis in PTC. (A) Representative immunohistochemical staining profile of PTC tissue samples with (N1) or without (N0) lymph node metastasis. (B) The expression of XBP1s in N1 and N0 groups according to the SI of IHC. (C) ROC curve analyses to distinguish N1 patients. Differences between groups in (B) assay were analyzed by two-tailed Student’s T-test. Error bars represent means ± SD.
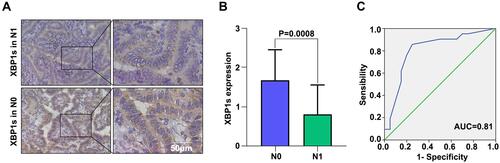
Table 3 Association of XBP1 Expression with Clinicopathologic Features in PTC Patients in TCGA
Figure 2 Decreased XBP1 expression in PTC tissue is associated with patient prognosis. (A–C) Relative levels of XBP1 transcripts in 505 TC, 230 TC whit N0, 58 TC with N1 and 59 non-tumor thyroid tissues in TCGA from UALCAN and original data. (D) (UALCAN), (E) (GEPIA) stratification analysis of XBP1 expression in the different stages of TC. (F and G) Kaplan–Meier curves showing the relationship of XBP1 expression to OS and DFS of patients with TC.
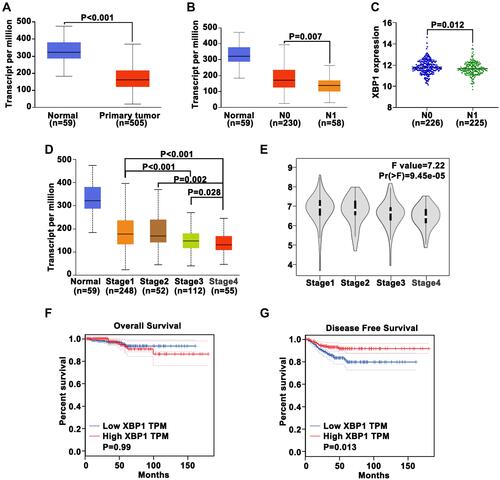
Figure 3 Overexpression of XBP1s reduces the invasive and metastatic potential of PTC cells, and inhibits EMT in PTC cells. (A) Cell migration and invasion assay. (B) Wound healing assay. Difference between two groups was tested using two-tailed Student’s T-test. Data are expressed as the mean ± SD of each group of cells from three separate experiments. *P<0.05; **P<0.01; ***P<0.001.
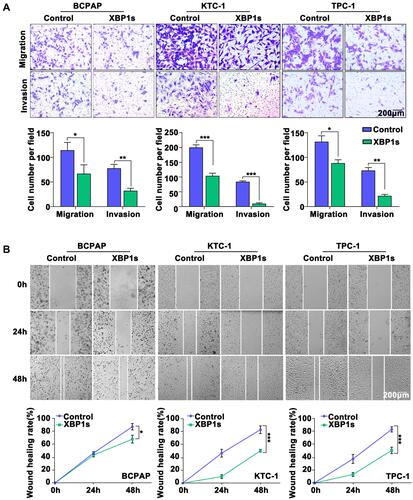
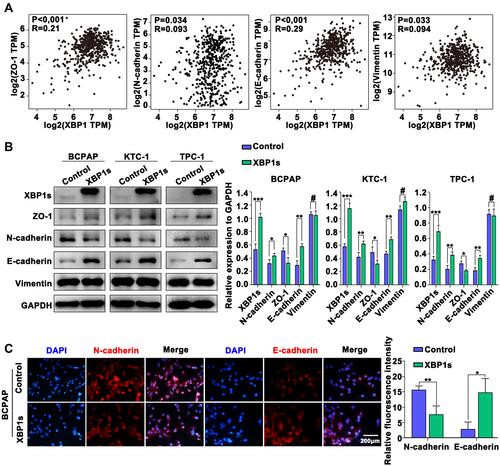
Figure 4 Overexpression of XBP1s inhibits EMT in PTC cells. (A) Correlation analysis between XBP1 and EMT-related markers (ZO-1, N-cadherin, E-cadherin and Vimentin) in TCGA (GEPIA). (B) Western blot analysis of the expression of XBP1s and EMT-related markers in PTC cells. (C) Immunofluorescence analysis of the expression of N-cadherin and E-cadherin in PTC cells. Difference between two groups was tested using two-tailed Student’s T-test. Data are expressed as the mean ± SD of each group of cells from three separate experiments. *P<0.05; **P<0.01; ***P<0.001, #P>0.05.