Figures & data
Table 1 Colitis Gradation Was Scored According to a Previous ReportCitation29
Figure 1 GDC-0575 impairs the development of colitis-associated cancer in mice. (A) IHC staining of CHK1 expression in colons of CAC mice treated with DMSO or GDC-0575. The percentage of CHK1 positive cells in each frame was analyzed. Scale bar = 100 μm. (B) Image of colons of CAC mice treated with DMSO or GDC-0575. (C) The tumor number in colons of CAC mice treated with DMSO or GDC-0575 (n=5, **p<0.01). (D) The tumor area in colons of CAC mice treated with DMSO or GDC-0575 (n=5, **p<0.01). (E) H&E staining of colons from colons from CAC mice treated with DMSO or GDC-0575. The tumor area in each frame was analyzed (n=4, **p<0.01). Scale bar = 200 μm. (F) IHC staining of PCNA expression in colons of CAC mice treated with DMSO or GDC-0575. The percentage of PCNA positive cells in each frame was analyzed. Scale bar = 100 μm, **p<0.01.
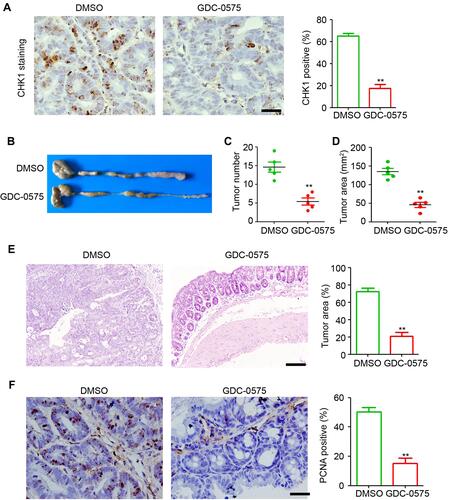
Figure 2 GDC-0575 impairs the development of colitis in mice. (A) qPCR analysis of CHK1 expression in colons of colitis mice treated with DMSO or GDC-0575 (n=3, **p<0.01). (B) The survival analysis of colitis mice treated with DMSO or GDC-0575 (n=10, Log-rank (Mantel-Cox) test). (C) The body weight analysis of colitis mice treated with DMSO or GDC-0575 (n=5, **p<0.01). (D) Hemoccult analysis of colitis mice treated with DMSO or GDC-0575 (n=5, **p<0.01). (E) Stool consistency analysis of colitis mice treated with DMSO or GDC-0575 (n=5, **p<0.01). (F) Image of colons of colitis mice treated with DMSO or GDC-0575. (G) Colon length of colitis mice treated with DMSO or GDC-0575 (n=5, **p<0.01). (H) H&E staining of colons from colons from colitis mice treated with DMSO or GDC-0575. The histologic score was analyzed (n=5, **p<0.01; Scale bar = 200 μm).
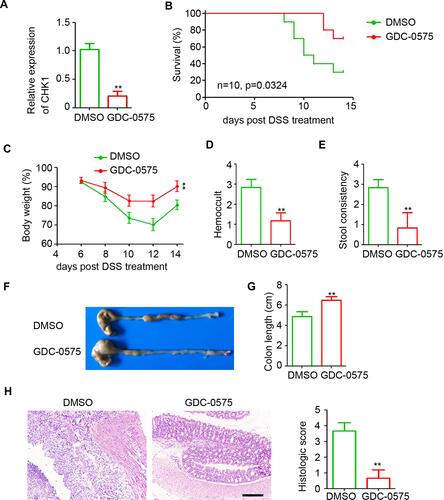
Figure 3 GDC-0575 inhibits the infiltration of macrophages in colons. (A) Flow cytometry analysis of immune cells infiltration in colons of CAC mice treated with DMSO or GDC-0575 (n=3, **p<0.01). (B) Immunofluorescence staining of F4/80 and iNOS expression in colons of CAC mice treated with DMSO or GDC-0575. The percentage of F4/80 and iNOS positive cells in each frame was analyzed (n=3, **p<0.01; Scale bar = 200 μm). (C) Immunofluorescence staining of F4/80 and iNOS expression in colons of colitis mice treated with DMSO or GDC-0575. The percentage of F4/80 and iNOS positive cells in each frame was analyzed (n=3, **p<0.01; Scale bar = 200 μm).
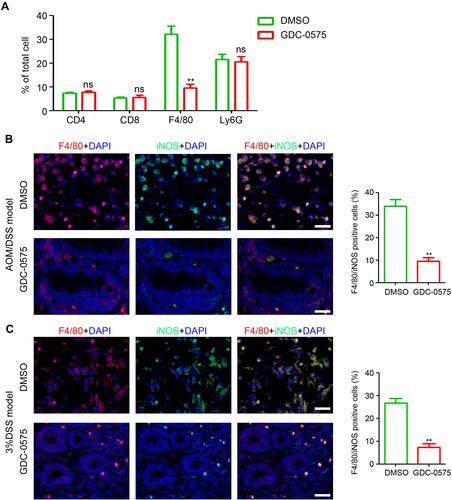
Figure 4 GDC-0575 regulates inflammatory cytokines expression in colons. (A) ELISA analysis of TNF-α, IL-6, IL-1β, COX-1, and IL-10 expression in colons of CAC mice treated with DMSO or GDC-0575 (n=3, **p<0.01). (B) ELISA analysis of TNF-α, IL-6, IL-1β, COX-2 and IL-10 expression in colons of colitis mice treated with DMSO or GDC-0575 (n=3, **p<0.01).
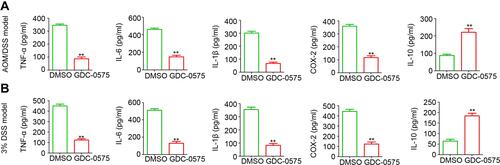
Figure 5 GDC-0575 inhibits CCL-2 expression and CCR2+ macrophages infiltration in colons. (A) ELISA analysis of CCL2 expression in colons of CAC mice and colitis mice treated with DMSO or GDC-0575 (n=3, **p<0.01). (B) ELISA analysis of CCL2 expression in colons of CAC mice and colitis mice treated with DMSO or GDC-0575 (n=3, **p<0.01). (C) Immunofluorescence staining of F4/80 and CCR2 expression in colons of CAC mice treated with DMSO or GDC-0575. The percentage of F4/80 and CCR2 positive cells in each frame was analyzed (n=3, **p<0.01; Scale bar = 200 μm). (D) Immunofluorescence staining of F4/80 and CCR2 expression in colons of colitis mice treated with DMSO or GDC-0575. The percentage of F4/80 and CCR2 positive cells in each frame was analyzed (n=3, **p<0.01; Scale bar = 200 μm).
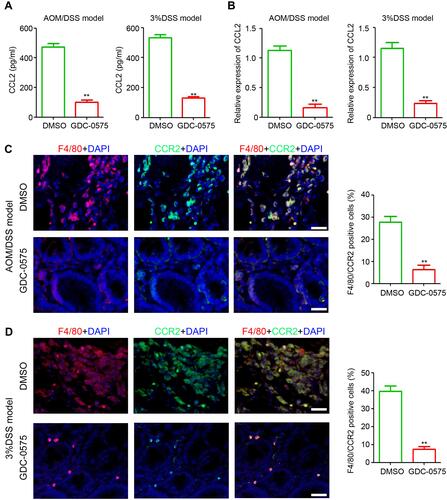
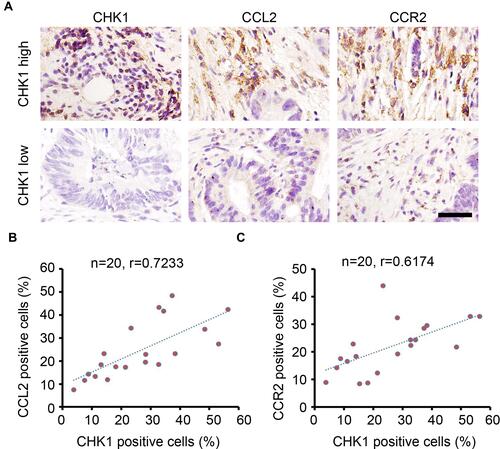
Figure 6 CHK1 correlates with CCL2 and CCR2 expression in colorectal cancer tissues. (A) IHC staining of CHK1, CCL2 and CCR2 expression in colorectal cancer tissues. Scale bar = 100 μm. (B) Correlation analysis of the percentage of CHK1 and CCL2 positive cells in each sample (n=20, r = 0.7233). (C) Correlation analysis of the percentage of CHK1 and CCR2 positive cells in each sample (n=20, r = 0.6174).