Figures & data
Table 1 The Clinical Characteristics of the OSCC Patients
Table 2 The Sequences of the Primers
Figure 1 ZEB1-AS1 overexpression in OSCC correlates with tumor progression and poor patient prognosis. (A, D) The relative expression of ZEB1-AS1 or miR-23a in OSCC and adjacent non-cancer tissues (n=30). (B, E) The relative expression of ZEB1-AS1 or miR-23a in OSCC tissues at different advanced stages of TNM. (C, F) The relative expression of ZEB1-AS1 or miR-23a in OSCC tissues at different pathology grades. (G, H) The relative expression of ZEB1-AS1 or miR-23a in the sera of OSCC patients pre- and post-operative. (I) Kaplan–Meier survival curve analysis of patients based on ZEB1-AS1 expression and OS rates. **P < 0.001; ***P < 0.0001.
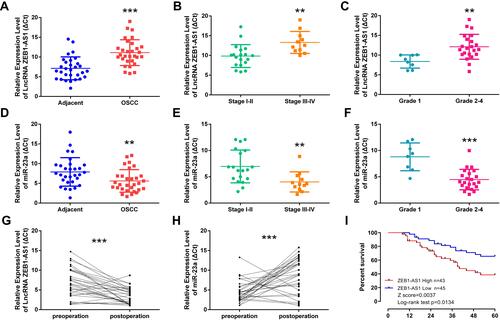
Figure 2 ZEB1-AS1 knockdown inhibits OSCC cell proliferation in vitro. (A) The relative expression of ZEB1-AS1 in OSCC cell lines. (B, C) The expression of ZEB1-AS1 in OSCC cell lines following sh-ZEB1-AS1 transfection. (D–G) EdU assay in OSCC cell lines following ZEB1-AS1 knockdown. (H–K) The percentage of cells at S phase following ZEB1-AS1 knockdown. Data are presented as the means ± SD. *P < 0.05; **P < 0.001; ***P < 0.0001. Scale bar=50μm.
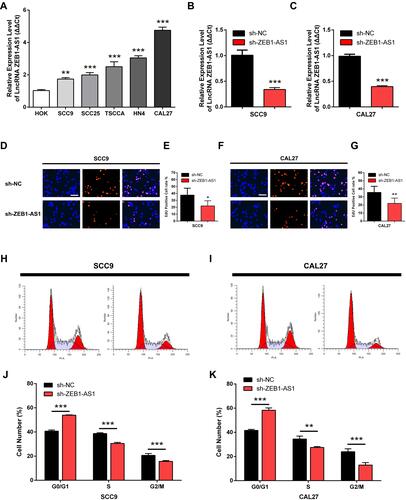
Figure 3 ZEB1-AS1 knockdown inhibited OSCC cell migration and invasion. (A–D) The cell migration distance following sh-ZEB1-AS1 transfection. (E–H) The number of migrated cells following sh-ZEB1-AS1 transfection. (I–L) The number of invaded cells following sh-ZEB1-AS1 transfection. (M, N) The expression of EMT-related genes vimentin, N-cadherin, and E-cadherin following sh-ZEB1-AS1 transfection in OSCC cell lines. (O) The protein levels of vimentin, N-cadherin, and E-cadherin following sh-ZEB1-AS1 transfection in OSCC cell lines. Data are presented as the means ± SD. *P < 0.05; **P < 0.001; ***P < 0.0001. Scale bar=50μm.
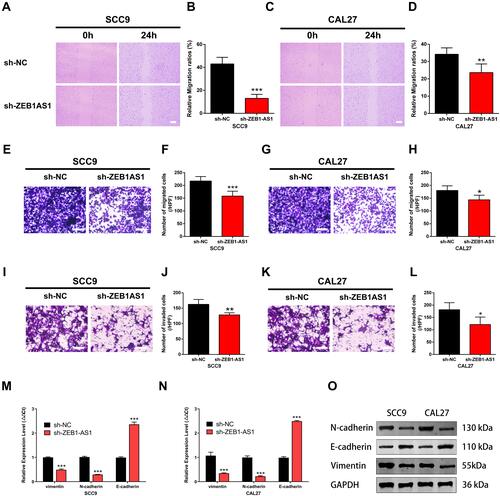
Figure 4 ZEB1-AS1 acted as a miR-23a sponge in OSCC cell lines. (A) The predicted binding sites between miR-23a and ZEB1-AS1. (B) Luciferase activity in 293T cells measured using a DLR assay. (C, D) Expression of miR-23a in OSCC cell lines following ZEB1-AS1 knockdown. Data are presented as the means ± SD. **, P < 0.001; ***, P < 0.0001.
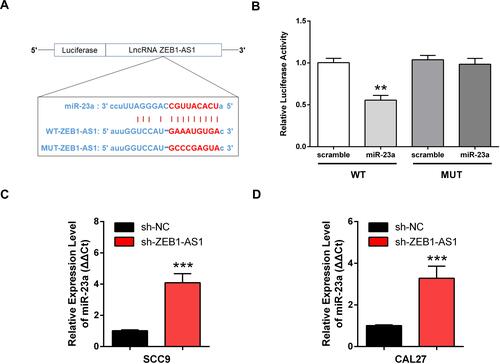
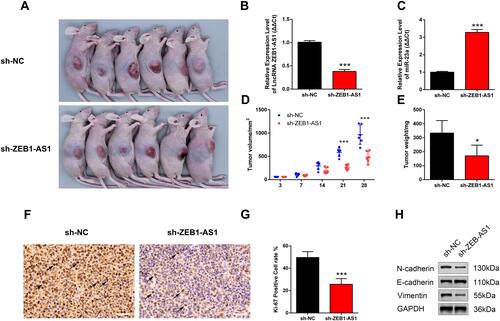
Figure 5 ZEB1-AS1 knockdown inhibited OSCC progression. (A) A gross look of xenograft tumors. (B, C) The relative expression of ZEB1-AS1 and miR-23a in OSCC xenograft tissues. (D) Tumor volumes were examined at days 3, 7, 14, 21, and 28 (n=6). (E) Tumor weights measured at day 28 (n=6). (F, G) Tumor cell proliferation was detected with IHC using an antibody against Ki-67. (H) The protein levels of vimentin, N-cadherin, and E-cadherin in OSCC xenograft tissues. Data are presented as the means ± SD. *, P < 0.05; ***, P < 0.0001. Scale bar=50μm.