
Figures & data
Table 1 Comparison of TAP Between Nontumor Patients and Gastric Adenocarcinoma Patients
Table 2 Baseline Characteristics of Patients with Gastric Adenocarcinoma
Table 3 Correlation Between TAP and Tumor Markers in Patients with Gastric Adenocarcinoma
Figure 1 ROC curve of TAP, CEA and CA199 in the diagnosis of gastric adenocarcinoma.
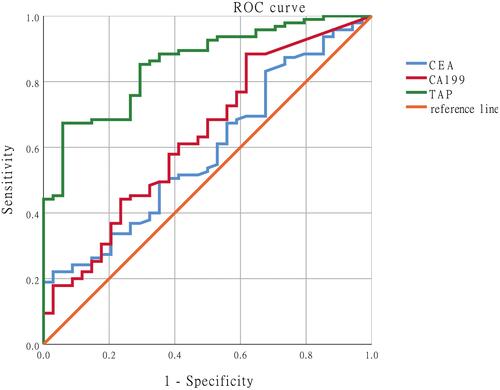
Table 4 Correlation Between TAP and Fasting Blood-Glucose
Table 5 Correlation Between TAP and Uric Acid
Table 6 Correlation Between TAP and Coagulation Function
Table 7 Correlation Analysis of TAP and CA199 in the Patients with Their Tumor Stage
Table 8 Correlation Analysis of CA199, CA72-4, APTT in the Patients with TAP Grouping