Figures & data
Figure 1 (A) The pathological findings of colonoscopy biopsy. It shows that atypical cells are arranged in an irregular glandular tube-like arrangement, with large and deeply stained nuclei and obvious mitosis (H&E, 40x). (B) The microscopic findings of the resected specimen. There is only mucus but no exact cancer cells were found (H&E, 40x).
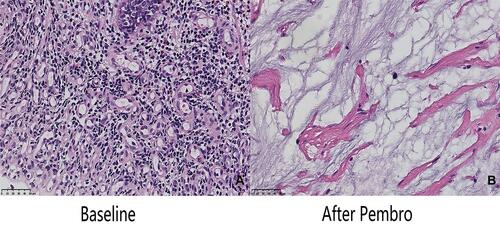
Figure 2 The intestinal and kidney mass treatment effect images of patient at baseline, after pembrolizumab and after surgery, respectively. The red arrow indicates the lesion.
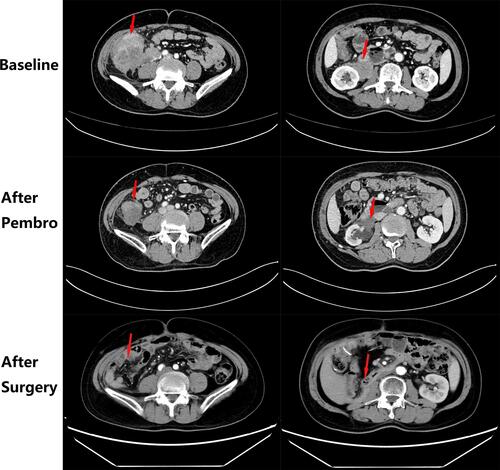
Figure 3 Immunohistochemical staining for MLH1, MSH2, MSH6, and PMS2 on the intestinal biopsy samples reveal loss of MLH1 and PMS2 protein expression (40x).
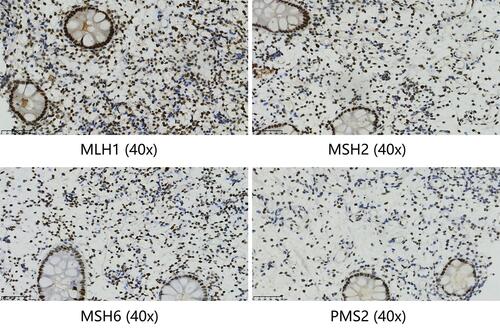
Figure 4 The irradiated gross tumor volume and the radiation dose plan.
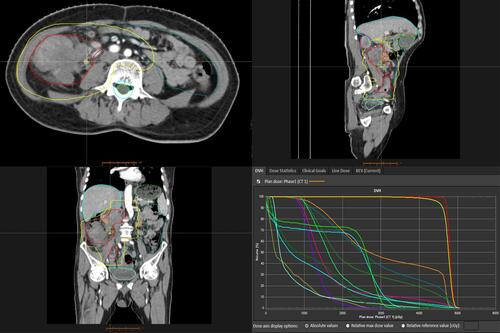
Figure 5 Dynamic change curves of CEA in peripheral blood during the whole treatment process.
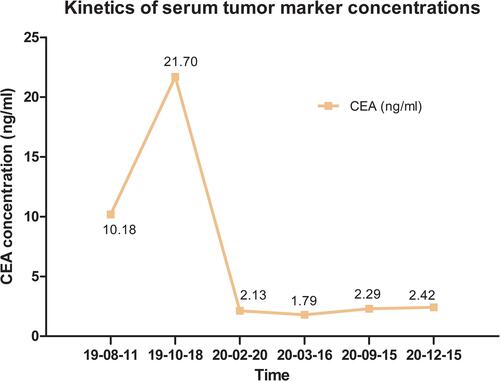
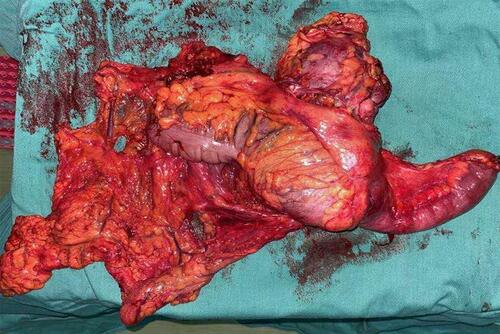
Figure 6 Resection samples of intestines and kidneys.