Figures & data
Table 1 Enrichment Results of Genomic Features of Differentially Methylated Sites
Figure 1 Manhattan figure and volcano map of differentially methylated sites. (A) Manhattan figure of differentially methylated sites in the chromosome. The X-axis and Y-axis represent the chromosome and the -log10 (FDR) of differentially methylated sites, respectively. (B) Volcano map of differentially methylated sites. The X-axis and Y-axis represents Δβ and -log10 (FDR), respectively. Green represent hypomethylation and and red represent hypermethylation. FDR, false discovery rate.
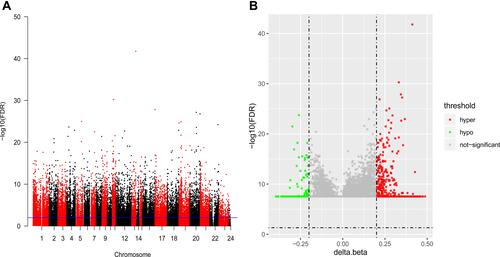
Figure 2 Heat map of the top 200 differentially methylated sites in terms of tumor stage, histologic diagnosis and sex. The figure shows the two-way hierarchical clustering results of the top 200 differentially methylated sites and samples. The clustering is constructed using the full chain method together with the Euclidean distance. Each row and column represents a differentially methylated sites and a sample, respectively. Differentially methylated sites clustering tree is shown on the right. Red indicates below the reference channel. Blue indicates the above reference.
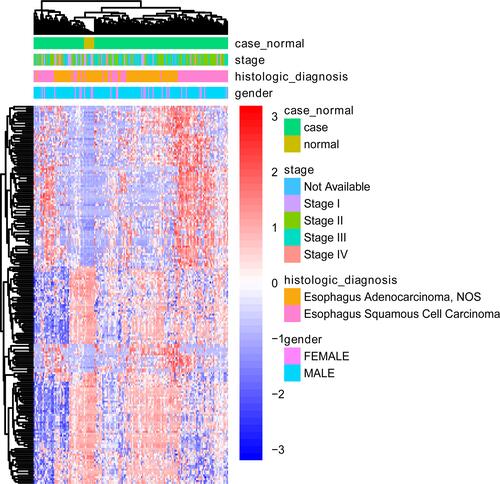
Table 2 Correlation Analysis Results Between the Modules and Tumor-Paracancer
Table 3 Enrichment of Modules in DEGs
Table 4 Details of Hub Genes in the Royal Blue Module
Figure 3 Clustering results of mRNA modules according to WGCNA analysis. The genes in the modules were marked with different colors, and the lower panel presents the color assigned to each module. WGCNA, Weighted Gene Co-Expression Network Analysis.
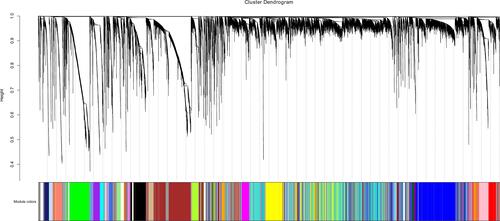
Figure 4 Visualization of the royal blue module in the WGCNA co-expression network. The circle and gray edge line represents the genes in the modules and the edge, respectively. The larger circle represent the hub genes. WGCNA, Weighted Gene Co-Expression Network Analysis.
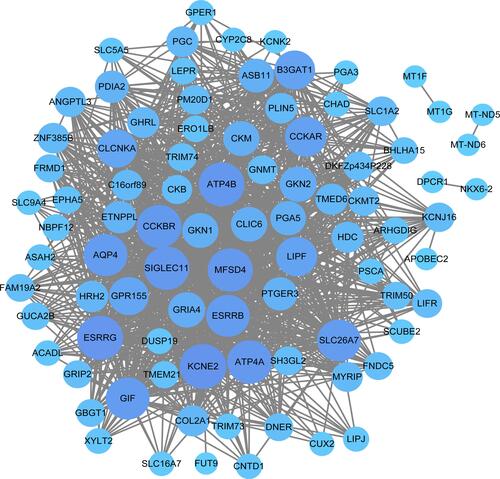
Table 5 Correlation Analysis Between Differential Methylated Sites and DEGs
Table 6 Enrichment of Differentially Methylated and DEGs in Modules
Figure 5 Electronic verification of ATP4A, ATP4B, CCKAR, MFSD4 and ESRRG at the mRNA level. (A) Electronic expression verification of ATP4A; (B) Electronic expression verification of ATP4B; (C) Electronic expression verification of CCKAR; (D) Electronic expression verification of MFSD4; (E) Electronic expression verification of ESRRG. P<0.05 was considered to indicate a statistically significant different. Blue color and yellow color represent the control group and the case group, respectively.
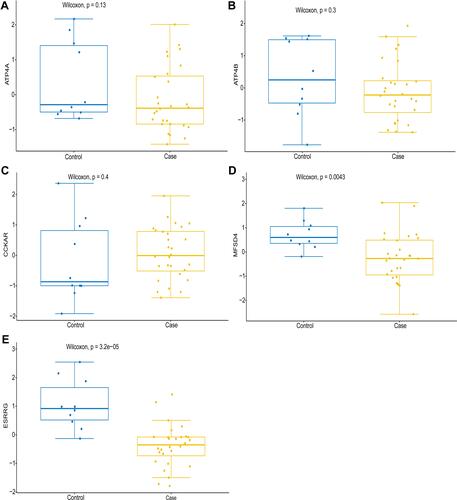
Figure 6 ROC curve of ATP4A, ATP4B, CCKAR, MFSD4, ESRRG (A–E) and prognostic analysis of MFSD4 (F).
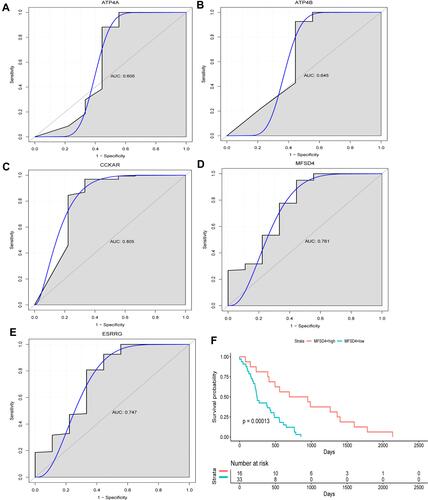
Table 7 Clinical Information of Patients and Normal Controls in the RT-qPCR
Table 8 Primer Sequences in the RT-qPCR
Figure 7 RT-qPCR validation of GPR155, ESRRB, ESRRG, CCKAR, MMP11, TPX2, BIRC5, NUF2 and ANO1 in tissue samples. *Represent p<0.05, **Represent p<0.01, ***Represent p<0.001. P<0.05 was considered statistically significant. Fold change >1 represent up-regulation, Fold change <1 represent down-regulation. RT-qPCR, reverse transcription PCR.
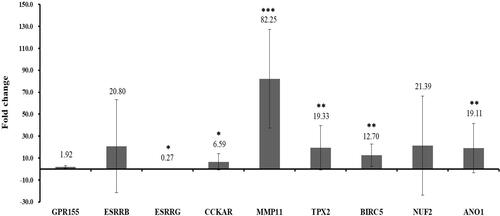
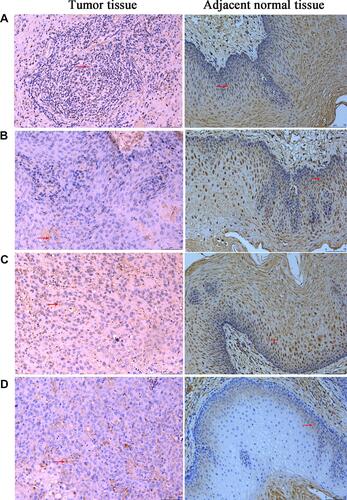
Figure 8 Immunohistochemical analysis of ATP4B (A), B3GAT1 (B), CCKBR (C) and ESRRG (D). The arrow represents positive ATP4B, B3GAT1, CCKBR and ESRRG staining. The length of scale bars in (A–D) was 75 μm. Magnification, 200x.