Figures & data
Figure 1 LHFPL3-AS1 is upregulated in OSCC and associated with cisplatin resistance. (A) Levels of LHFPL3-AS1 in OSCC cell lines. (B) LHFPL3-AS1 expression in OSCC tissues by qRT-PCR. (C) Overall and disease-free survival rates based on LHFPL3-AS1 median value in OSCC tissues. (D) Analysis of cisplatin-resistance in SSC9 and SCC9-R cells by CCK8 assay. (E) Analysis of cisplatin-resistance in CAL27 and CAL27-R cells by CCK8 assay. (F) Relative expression of LHFPL3-AS1 in indicated cell lines. *P<0.05.
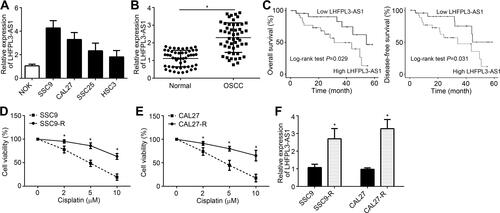
Figure 2 LHFPL3-AS1 knockdown inhibits OSCC development and cisplatin resistance. (A) Relative expression of LHFPL3-AS1 after transfection with siRNAs. (B) CCK8 assay for cell proliferation analysis. (C) Relative colony formation was determined to analyze cell proliferation. (D) Cell cycle distribution was analyzed. (E and F) Cell migration and invasion analyses by Transwell assay. (G) Relative expression of LHFPL3-AS1 in cisplatin-resistant cell lines after transfection of siRNAs. (H) Cell proliferation potential of SCC9-R and CAL27-R cells was assessed in the presence of cisplatin after transfection with siRNAs. *P<0.05.
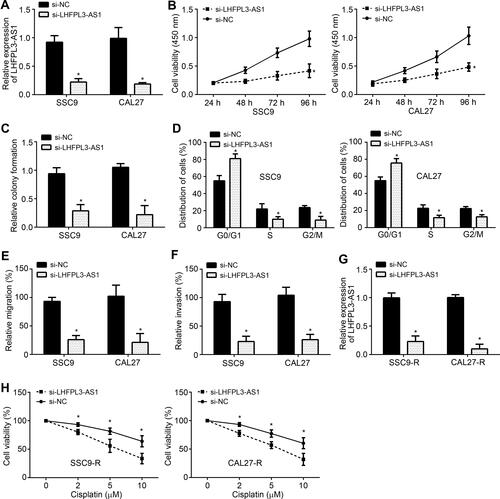
Figure 3 LHFPL3-AS1 works as the ceRNA for miR-362-5p. (A) Predicted binding site between LHFPL3-AS1 and miR-362-5p by miRDB software. (B) Luciferase reporter assay. (C) Relative expression of miR-362-5p in OSCC tissues. (D) Expression correlation between LHFPL3-AS1 and miR-362-5p in OSCC tissues. (E) RT-qPCR analysis of miR-362-5p levels after siRNA transfection. *P<0.05.
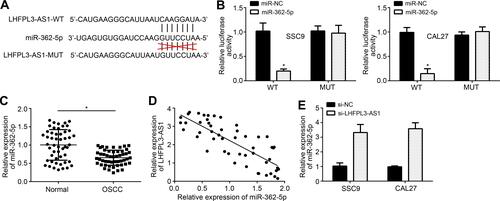
Figure 4 miR-362-5p targets CHSY1. (A) Predicted binding site between miR-362-5p and CHSY1 by TargetScan software. (B) Luciferase reporter assay. (C) Relative expression of CHSY1 in OSCC tissues. (D) Expression correlation between miR-362-5p and CHSY1 in OSCC tissues. (E) RT-qPCR analysis of CHSY1 after miR-362-5p mimic transfection. (F) CCK8 assay for proliferation analysis. (G and H) Transwell assay for analysis of migration and invasion. *P<0.05.
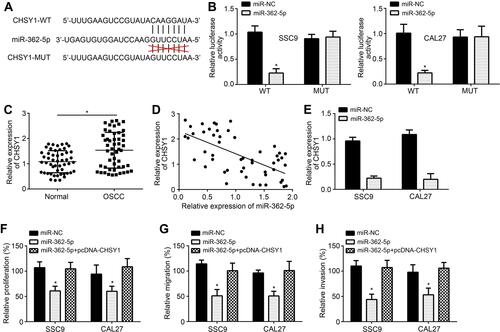
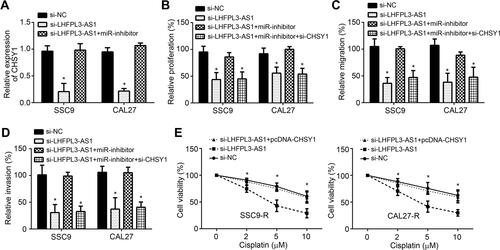
Figure 5 LHFPL3-AS1/miR-362-5p/CHSY1 cascade promotes OSCC development. (A) qRT-PCR analysis of CHSY1 expression. (B) CCK8 assay for cell proliferation analysis. (C and D) Transwell assay for migration and invasion assessment. (E) Cell proliferation assay by CCK8 using SCC9-R and CAL27-R cells. *P<0.05.