Figures & data
Table 1 All Primers in This Study
Table 2 All Antibodies Information and Sources in This Study
Table 3 The Correlations Between the Expression of circHIPK3 and Clinicopathological Features of Breast Cancer Patients
Figure 1 CircHIPK3 had a strong RNase R resistance and was high-expressed in breast cancer (BCa) tissues and cells. (A) The expression of circHIPK3 in BCa tissues (n = 48) and ANT (n = 48) was determined by RT-qPCR. (B) The expression of circHIPK3 in BCa cells was determined by RT-qPCR. (C) Ribonuclease R (RNase R) was used to treat MCF7 and BT20 cells to detect the RNase R resistance of circHIPK3 and HIPK3. (D) The expressions of circHIPK3 and HIPK3 in cytoplasm and nuclear of MCF7 and BT20 cells were determined by RT-qPCR. Real-time quantitative PCR (RT-qPCR). Experiments were repeated in triplicates. GAPDH was set as control. ###P < 0.001 vs adjacent tissue (ANT); **P < 0.01, ***P < 0.001 vs MCF-10A; ^^^P < 0.001 vs RNase R-.
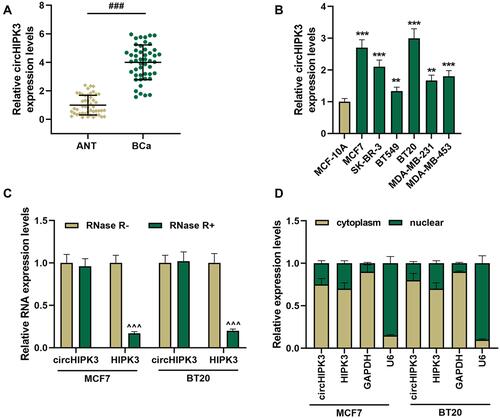
Figure 2 Silencing circHIPK3 suppressed the malignant phenotype of breast cancer (BCa) cells. (A) The transfection rate of sicircHIPK3 into MCF7 and BT20 cells was determined by RT-qPCR. (B) sicircHIPK3 inhibited the viability of BCa cells, as detected by CCK-8. (C and D) The effect of sicircHIPK3 on the proliferation of BCa cells was determined by the clone formation assay. (E and F) Wound healing assay was used to detect the effect of sicircHIPK3 on BCa cell migration (magnification × 100). (G and H) The invasion ability of BCa cells was detected by Transwell (magnification × 250). Experiments were repeated in triplicates. Cell counting kit-8 (CCK-8). ^^P < 0.01, ^^^P < 0.001 vs siNC.
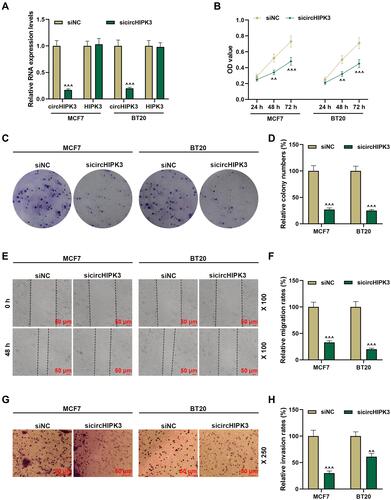
Figure 3 MiR-326 was negatively regulated by circHIPK3 and was down-regulated in breast cancer (BCa). (A) CircInteractome predicted, (B) dual-luciferase analysis and (C) RIP assay of the binding relationship between circHIPK3 and miR-326. (D) MCF7 and BT20 cells were transfected with sicircHIPK3, and RT-qPCR was used to determine the expression of miR-326. (E) The expression of miR-326 in BCa tissues and adjacent tissues (n=48) was measured by RT-qPCR. (F) The correlation between miR-326 and circHIPK3 expression was analyzed by Pearson. Experiments were repeated in triplicates. GAPDH or U6 was set as control. ###P < 0.001 vs ANT; **P < 0.01 vs IC; †††P < 0.001 vs IgG; ^^^P < 0.001 vs siNC.
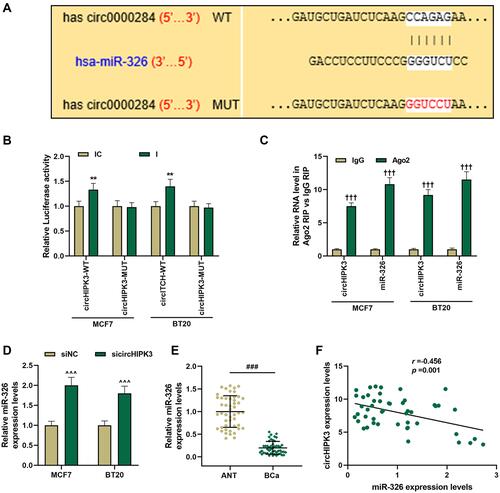
Figure 4 The effect of circHIPK3 on cell viability and proliferation of breast cancer (BCa) cells was reversed by miR-326. (A) The expression of circHIPK3 in NC + MC, circHIPK3+ MC, NC + M, circHIPK3 +M groups was determined by RT-qPCR. (B) The expression of miR-326 in NC + MC, circHIPK3+ MC, NC + M, circHIPK3 +M groups was determined by RT-qPCR. (C) CCK-8 was constructed to detect the viability of BCa cells. (D) The cell proliferation was determined by the clone formation assay. Each experiment was repeated three times independently. GAPDH or U6 was set as control. *P < 0.05, **P < 0.01, ***P < 0.001 vs NC + MC; ^^P < 0.01, ^^^P < 0.001 vs circHIPK3+ MC; ##P< 0.01, ###P < 0.001 vs NC + M.
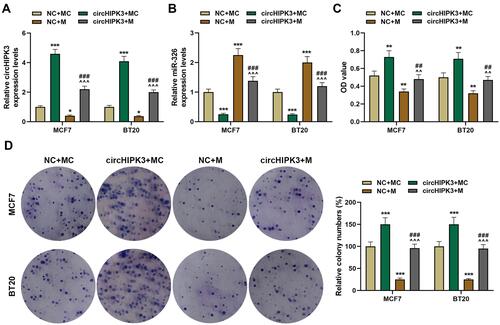
Figure 5 Overexpression of miR-326 partially offset the effect of circHIPK3 on cell migration, invasion and apoptosis of breast cancer (BCa). (A and B) Cell migration in NC + MC, circHIPK3+ MC, NC + M, and circHIPK3 +M groups was determined by the wound-healing assay (magnification × 100). (C and D) The number of cell invasion in each group was detected by Transwell (magnification × 250). (E and F) Flow cytometry was performed to detect cell apoptosis in each group at 48 h MCF7 and BT20 cells transfected with circHIPK3 and miR-326 alone or combined. Each experiment was repeated three times independently. *P < 0.05, **P < 0.01, ***P < 0.001 vs NC + MC; ^^^P < 0.001 vs circHIPK3 + MC; ###P < 0.001 vs NC + M.
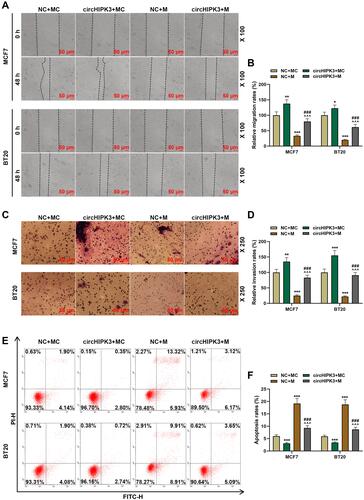
Figure 6 Overexpression of miR-326 partially reversed the effect of circHIPK3 on apoptosis and epithelial–mesenchymal transition-related genes. (A–C) The expressions of apoptosis-related genes (cleaved Caspase-3, Bcl-2 and Bax) in NC + MC, circHIPK3+ MC, NC + M, and circHIPK3 +M groups were detected by Western blot and RT-qPCR. (D–F) The expressions of E-Cadherin, N-Cadherin and vimentin in NC + MC, circHIPK3+ MC, NC + M, and circHIPK3 +M groups were detected by Western blot and RT-qPCR. Each experiment was repeated three times independently. GAPDH was set as control. *P < 0.05, **P < 0.01, ***P < 0.001 vs NC + MC; ^P < 0.05, ^^P < 0.01, ^^^P < 0.001 vs circHIPK3 + MC; #P < 0.05, ##P < 0.01, ###P < 0.001 vs NC + M.
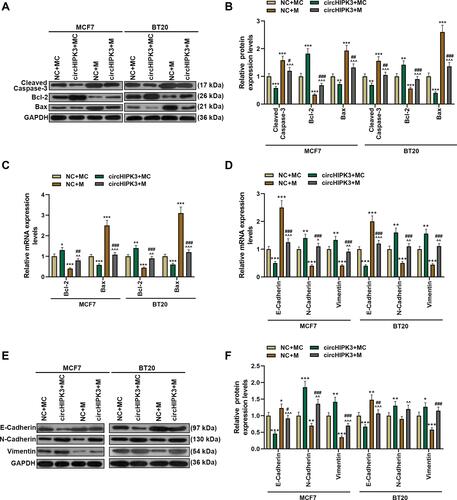
Figure 7 MiR-326 partially overturned the function of circHIPK3 to promote tumor growth and regulate the expressions of apoptosis-related proteins. (A and B) Xenograft tumor experiment was used to analyze the effects of circHIPK3 and miR-326 on tumor growth in mice. (C–E) RT-qPCR andWestern blot was performed to detect apoptosis-related proteins in tumor tissues of NC + MC, circHIPK3+ MC, NC + M, and circHIPK3 +M groups. Each experiment was repeated three times independently. *P < 0.05, ***P < 0.001 vs NC + MC; ^^^P < 0.001 vs circHIPK3 + MC; ##P < 0.01, ###P < 0.001 vs NC + M.
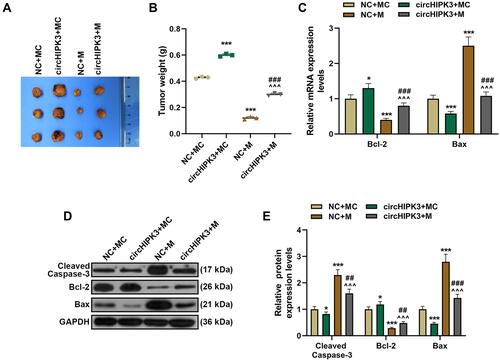
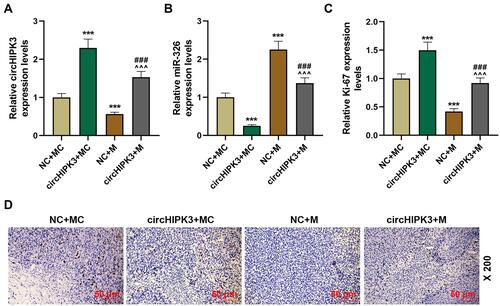
Figure 8 CircHIPK3 affected the level of Ki-67 through sponging miR-326. (A and B) The expressions of circHIPK3 and miR-326 in tumor tissues of NC + MC, circHIPK3+ MC, NC + M, circHIPK3 + M groups were determined by RT-qPCR. (C and D) The levels of Ki-67 in tumor tissues of each group were detected by immunohistochemistry (magnification × 200), and quantified the Ki-67 level. Each experiment was repeated three times independently. GAPDH or U6 was set as control. ***P < 0.001 vs NC + MC; ^^^P < 0.001 vs circHIPK3 + MC; ###P < 0.001 vs NC + M.