Figures & data
Table 1 Five HapMap Normal Samples and Their Dilution Ratios in Five Diluted Samples for SNV Validation
Table 2 Performance of SNV Calling at AF ≥5% for Five Diluted Samples at Different Sequencing Depths
Figure 1 Detected AF vs expected AF for five SNV diluted samples (A–E) and the reference standard sample HD701 (F).
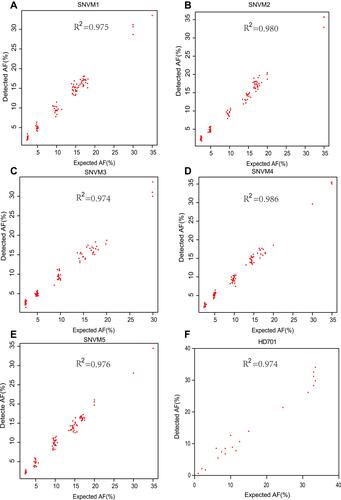
Table 3 Performance of INDEL Calling at AF ≥2% for Five Diluted Samples at Different Sequencing Depths
Figure 2 Detected AF vs expected AF for five INDEL diluted samples. Please note that the INDELs in these five diluted samples are plotted together.
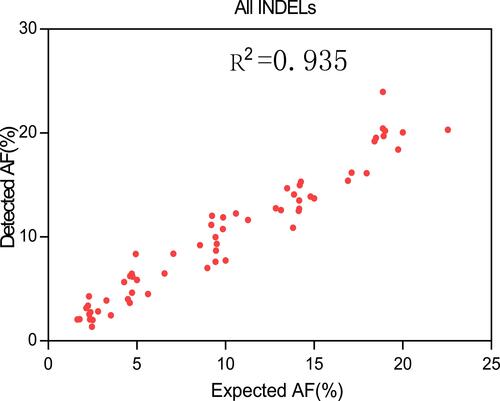
Table 4 The Validation Results of Reference Standard Sample HD701 at the Sequencing Depth of 500X for Confirmed Hotspot SNVs and INDELs
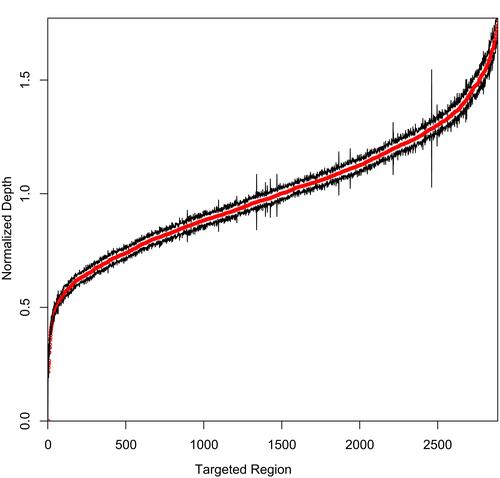
Figure 3 The normalized mean depths for all the targeted regions for different validation samples.