Figures & data
Figure 1 Cell viability of myeloma cells to Elotuzumab. (A) The cell viability of sensitive (U266/WT, UW) and Elotuzumab resistant (U266/EloR, UE) cell lines to Elotuzumab (ELO) coculture with peripheral blood mononuclear cells (PBMC). (B) The cell viability of lenalidomide resistance (U266/R10R, UR) and double resistance to lenalidomide plus Elotuzumab (U266/R10R/EloR, URE).
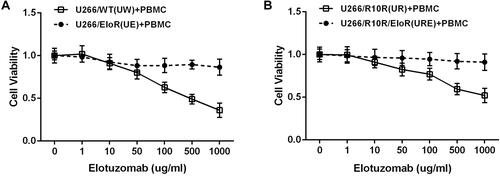
Figure 2 CCL20 expression decreased in resistant myeloma cell. (A) Heatmap for gene expression of four myeloma cells: UW, UR, UE, URE. (B) RT-qPCR to verify the relative expression of CCL20 gene in myeloma cell lines. (C) CCL20 gene expression in MM patient samples, 27 samples of bone marrow fluid from patients with newly diagnosed MM (NDMM) and 5 samples from relapsed refractory MM (RRMM) exposed to lenalidomide. (D) Bioinformatics analysis of CCL20 relative gene expression in NDMM and RRMM patient samples. MM_R is the patient who is resistant to lenalidomide. (E) CCL20 protein expression in plasma of NDMM and RRMM patients by ELISA. “*”Indicates a p value <0.05, “**”Indicates a p value <0.01, “***”Indicates a p value <0.001, “****”Indicates a p value <0.0001.
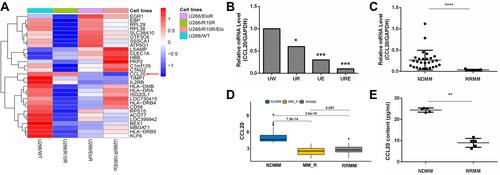
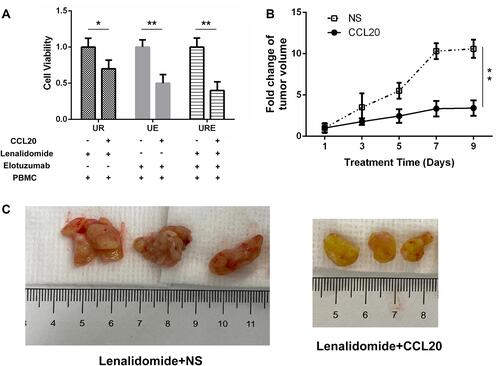
Figure 3 CCL20 increases drug sensitivity in vitro and in vivo. (A) Cell viability of UR, UE, URE cells treated with lenalidomide or Elotuzumab with or without CCL20. (B) Tumor volume growth rate of UR xenograft mice in the experimental group (lenalidomide+CCL20) and control group (lenalidomide+NS). (C) Tumor volume (blank control group on the left, experimental group on the right). “*”Indicates a p value <0.05, “**”Indicates a p value <0.01.