
Figures & data
Table 1 Clinical Characteristics of the Enrolled 125 Patients
Figure 1 (A) Therapeutic response in older patients treated with immune checkpoint inhibitors. (B) Therapeutic response in patients with poor performance status treated with immune checkpoint inhibitors.
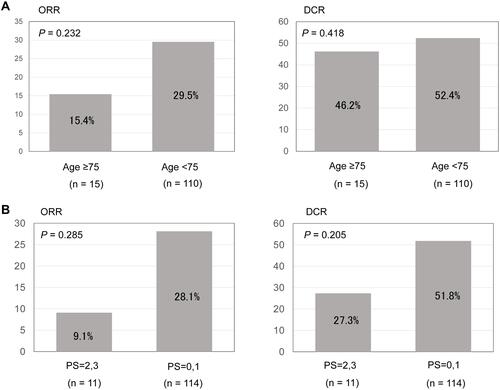
Figure 2 Kaplan–Meier curves for progression-free survival (A) and overall survival (B) among older and younger patients treated with immune checkpoint inhibitors. Kaplan–Meier curves for progression–free survival (C) and overall survival (D) among patients with performance status (PS) 0–1 or 2–3.
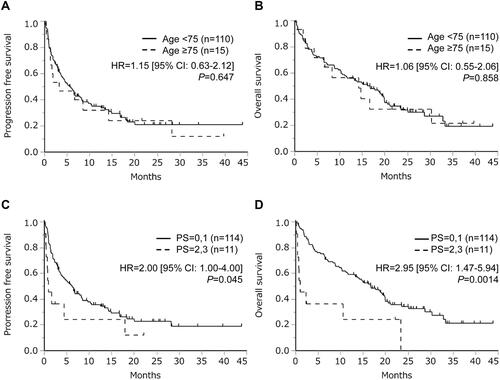
Figure 3 Overall survival following treatment with immune checkpoint inhibitors according to tumor programmed death ligand 1 (PD-L1) expression (the cut-off values of PD-L1 expression were (A) 50% and (B) 1%, respectively), and subgroup analysis of patients with poor performance status according to tumor PD-L1 expression (the cut-off values of PD-L1 expression were (C) 50% and (D) 1%, respectively). Patients lacking PD-L1 data were excluded in these analyses.
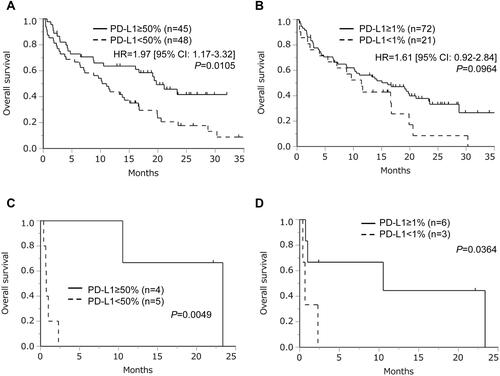
Table 2 Treatment-Related Adverse Events Among Patients Aged ≥75 Years or Those with Poor PS