Figures & data
Figure 1 GDC-0326 induced inhibition of CRC cell proliferation through upregulation of RIPK1/3. (A) Protein levels of RIPK1 and RIPK3 were detected by Western blotting after incubation with GDC-0326. (B and C) Colony formation of LoVo and HT-29 cells was observed, and the number of colonies formed was counted after 2 weeks of treatment with GDC-0326 at various concentrations. DMSO was added as a control. (D) Immunofluorescence images of RIPK1 and RIPK3 in CRC cells were captured after the addition of GDC-0326 for 48 h. Scale bar = 20 µm. (**P < 0.01).
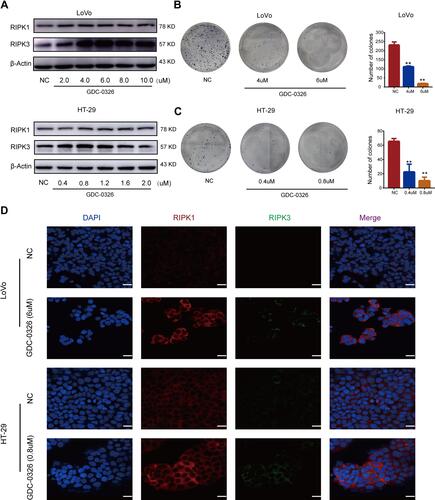
Figure 2 Clinical significance of RIPK1/3 expression in CRC based on the data extracted from TCGA. (A and B) Expression of RIPK1/3 was compared between tumor tissues and normal tissues in CRC. (C and D) Expression of RIPK1/3 was correlated with the prognosis of CRC patients. (**P < 0.01).
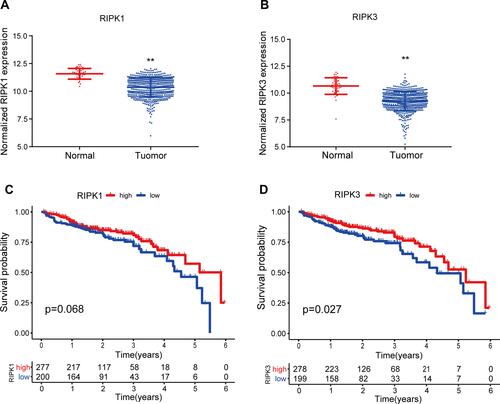
Figure 3 Effect of RIPK1/3 inhibitors on reversing the GDC-0326-induced decrease in CRC cell viability. (A and B) Western blot analysis revealed that Nec-1 inhibited GDC-0326-induced upregulation of RIPK1, and GSK-872 mitigated the increase in RIPK3 expression induced by GDC-0326 in both LoVo and HT-29 cells. (C and D) CCK-8 assay showed that Nec-1 and GSK-872 inhibited the death of CRC cells induced by GDC-0326. (**P < 0.01, #P < 0.05, ##P < 0.01).
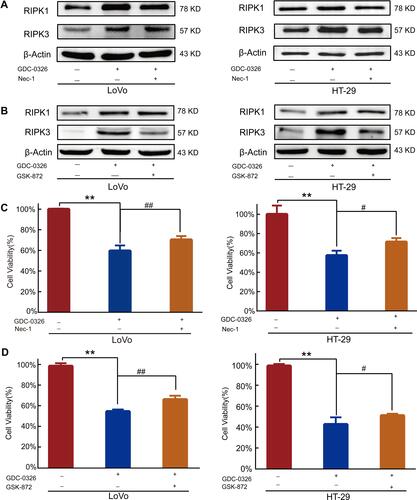
Figure 4 Promotive effect of GDC-0326 on improving the effect of 5-Fu in CRC cells. (A and B) The viability of LoVo and HT-29 cells was determined after incubation with 5-Fu for 48 h. (C and D) Cell viability was further assessed after treatment with various concentrations of GDC-0326 combined with 5-Fu. (E and F) The CI plots of GDC-0326 plus 5-Fu in LoVo and HT-29 cells were delineated. CI, combination index (CI).
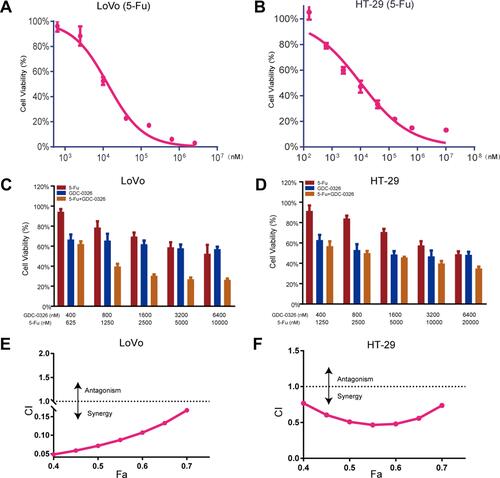
Figure 5 GDC-0326 enhanced the effects of 5-Fu on suppressing CRC tumor growth in vivo. (A) Growth curve of tumor volumes after injection of LoVo cells in xenograft nude mice from the DMSO, 5-Fu, GDC-0326, and combination treatment groups. (B and C) The xenografted tumors were surgically removed and photographed, as well as weighed (n = 5). (D) Protein levels of RIPK1 and RIPK3 were detected by Western blotting analysis in each group. β-Actin was used as a loading control. (E) H&E staining of tumor slices from different groups after various treatments (scale bar = 200 µm). (F) TUNEL immunofluorescence staining of tumor slices from the groups (scale bar = 100 µm). (**P < 0.01).
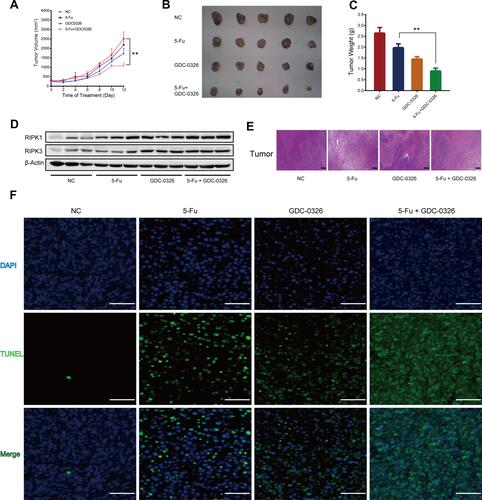
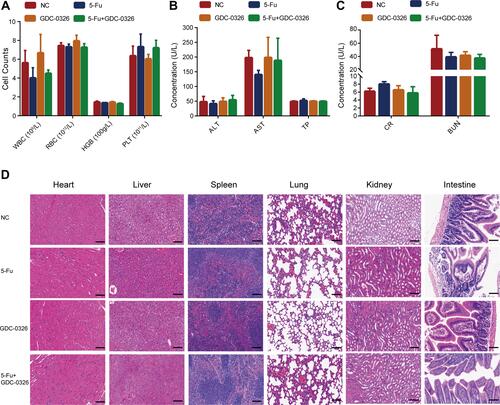
Figure 6 Safety of combination therapy with GDC-0326 and 5-Fu in tumor‐bearing mice. (A–C) Blood routine analysis and biochemical tests were performed in the mice, including white blood cell (WBC), red blood cell (RBC), hemoglobin (HGB), platelet (PLT), alanine transaminase (ALT), aspartate transaminase (AST), total protein (TP), creatinine (CR), and blood urea nitrogen (BUN) tests. For quantitative data, the total number of mice used was 5. (D) H&E staining images of tissues from tumor-bearing mice, including tissue from the heart, liver, spleen, lung, kidney, and intestine (scale bar = 100 µm).