Figures & data
Table 1 The Primers for Quantitative Real-Time Polymerase Chain Reaction, with β-Actin and U6 Used as the Control
Table 2 Differentially Expressed (DE) miRNAs Identified from GSE56350 and GSE70574 Dataset
Figure 1 Volcano plot and heat map of GSE56350, GSE70754, and GSE95109. (A) Unsupervised clustering analysis of differentially expressed (DE) miRNAs in GSE56350. Red dots indicate significantly up-regulated miRNAs, green dots indicate significantly down-regulated miRNAs. (B) Volcano plots of miRNAs in GSE56350. Red dots indicate up-regulated DEmiRNAs, green dots indicate down-regulated DEmiRNAs, black dots indicate non-differentially expressed miRNAs. (C) Unsupervised clustering analysis of DE miRNAs in GSE70754. Red dots indicate significantly up-regulated miRNAs, green dots indicate significantly down-regulated miRNAs. (D) Volcano plots of miRNAs in GSE70754. Red dots indicate up-regulated DEmiRNAs, green dots indicate down-regulated DEmiRNAs, black dots indicate non-differentially expressed miRNAs. (E) Unsupervised clustering analysis of the DE miRNAs in GSE95109. Red dots indicate significantly up-regulated miRNAs, green dots indicate significantly down-regulated miRNAs. (F) Volcano plots of miRNAs in GSE95109. Red dots indicate up-regulated DEmiRNAs, green dots indicate down-regulated DEmiRNAs, black dots indicate non-differentially expressed miRNAs.
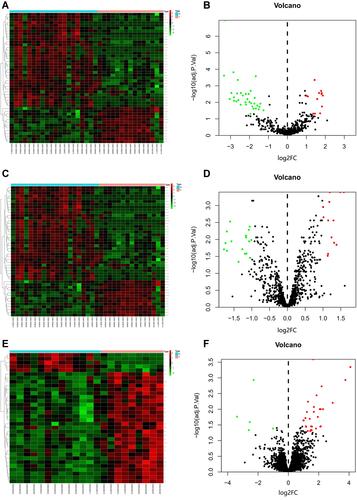
Figure 2 Venn Diagram of GSE48074 and GSE70574.
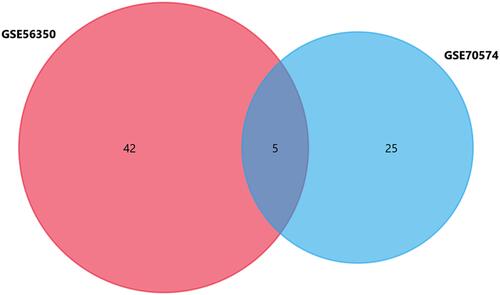
Figure 3 Screening of potential transcription factors and target genes of differentially expressed miRNAs. (A) Identification of the potential transcription factors of DEMs by FunRich software. (B) The top 10 of biological process, cellular component, and molecular function of the target genes of miRNAs. (C) KEGG pathway enriched by potential target mRNAs.
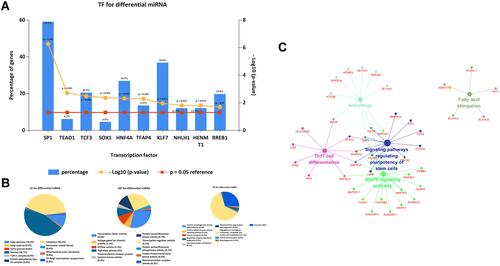
Figure 4 The PPI network of the target genes of the identified DEmRNAs.
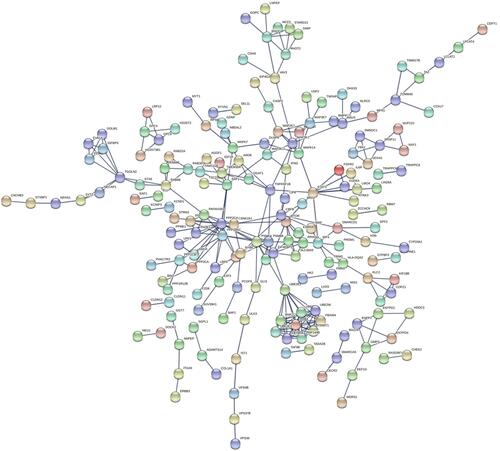
Figure 5 The miRNA-mRNA network of hsa-miR-100, hsa-miR-99a, and HS3ST2 in CRC tissues and CRCLN tissues. (A) Venn Diagram of target mRNAs and GSE95109. (B) Identified target mRNAs and miRNA-mRNA regulatory network.
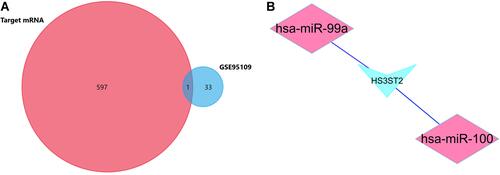
Figure 6 Identification of the signature significantly associated with the survival of patients with CRC in the training group. (A) LASSO Cox regression algorithm was used to reduce the scope. (B) Time-dependent ROC curves analysis. (C and D) Risk score distribution and survival status for patients in high- and low-risk groups by the signature (p<0.05).
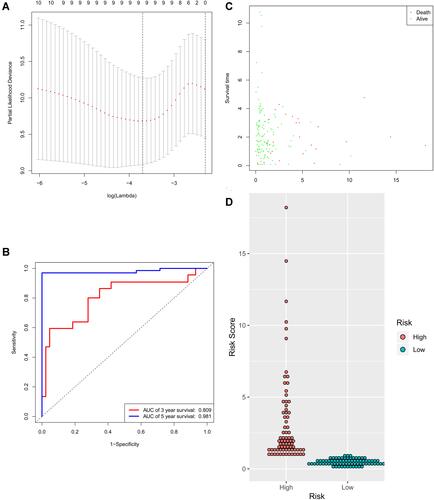
Figure 7 The differential expression of hsa-miR-100 and hsa-miR-99a in CRC tissues and their corresponding normal-appearing tissues. (A) Validation of hsa-miR-99a in GSE108153 (***p < 0.001). (B) Validation of hsa-miR-100 in GSE108153 (***p < 0.001). (C) Validation of hsa-miR-99a in GSE126093 (***p < 0.001). (D) Validation of hsa-miR-100 in GSE126093 (***p < 0.001). (E) Validation of HS3ST2 in GSE146587 (**p < 0.01). (F) Validation of HS3ST2 in GSE110224 (***p < 0.001).
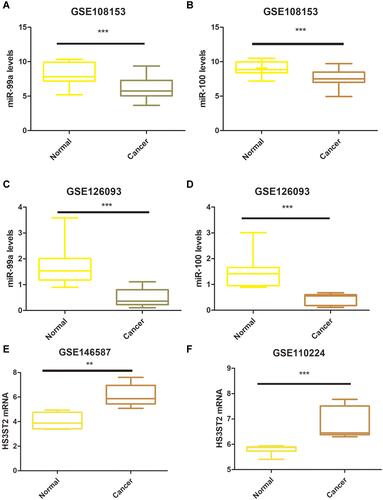
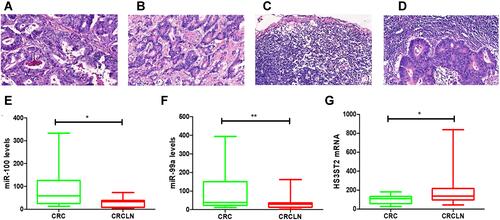
Figure 8 The expression level of hsa-miR-100, hsa-miR-99a, and HS3ST2 in CRC tissues and CRCLN tissues. (A–D) Hematoxylin and eosin (H&E) staining of CRC lymph node metastatic tissue and CRC lymph node nonmetastatic tissue (scale bar: 200×). (E) Validation of hsa-miR-100 (*p < 0.05). (F) Validation of hsa-miR-99a (**p < 0.01). (G) Validation of HS3ST2 (*p < 0.05).