Figures & data
Figure 1 Identification of differentially expressed miRNAs (DEMs) in choriocarcinoma. The before and after normalization and volcano plots of GSE20510 (A and B), GSE32346 (C and D) and GSE130489 (E and F). Characteristics of mRNA and miRNA expression profiles of choriocarcinoma (G). Venn diagram based on the miRNA expression profile of choriocarcinoma (H).
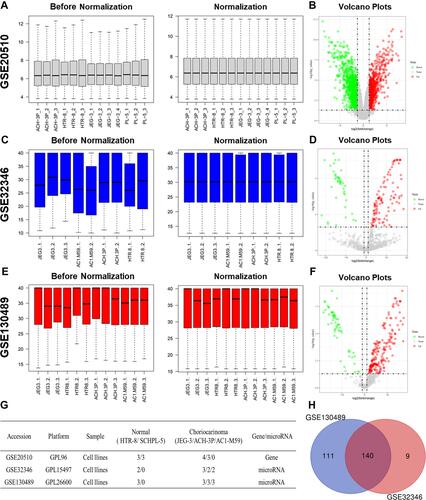
Figure 2 GO terms and KEGG pathway analysis of candidate DEGs in choriocarcinoma. (A) BP-associated category; (B) CC-associated category; (C) MF-associated category; (D) KEGG pathways.
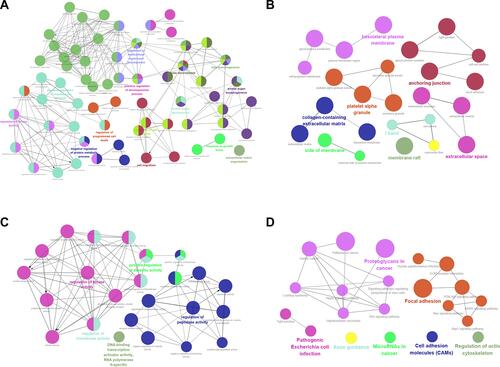
Figure 3 PPI network construction and module analysis. A total of 400 DEGs were visualized in the DEG PPI network (A). Module analysis using MCODE (B). The nodes represent proteins, and the edges represent the interaction of the proteins. Red nodes represent upregulated genes, and blue nodes represent downregulated genes.
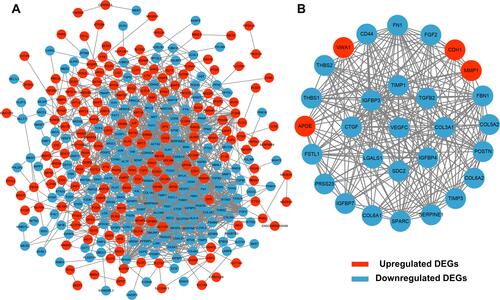
Figure 4 Regulatory networks of drug-hub gene interactions. Red nodes and blue nodes represent upregulated DEGs and downregulated DEGs, respectively. Pink nodes represent target drugs.
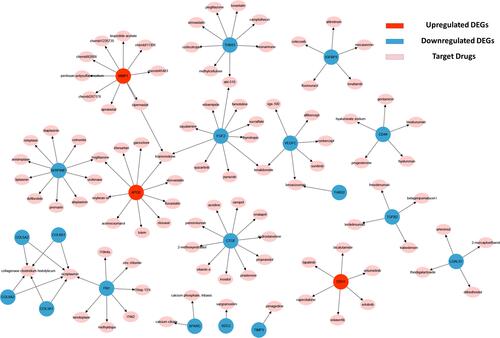
Figure 5 Identification of DETGs between DEGs and DEMs predicted target genes.
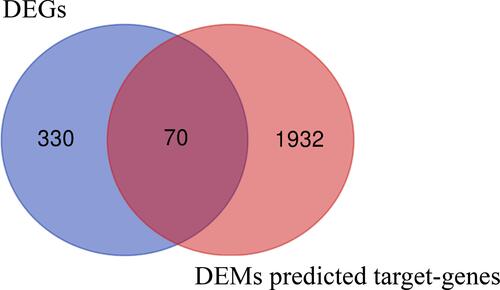
Figure 6 Construction of miRNA-target gene regulatory network. Red nodes and blue nodes indicate upregulated and downregulated DETGs, respectively. Diamonds represent DEMs.
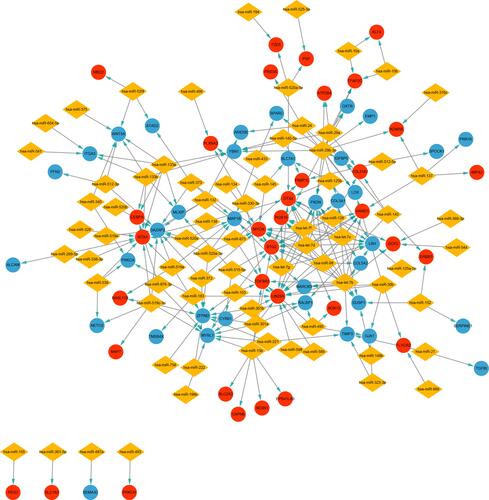
Figure 7 GO and KEGG analysis of hsa-miR-29b-3p, hsa-miR-519c-3p and hsa-miR-520a-5p. BP (A), CC (B) and MF (C) terms and enriched (D) KEGG pathways.
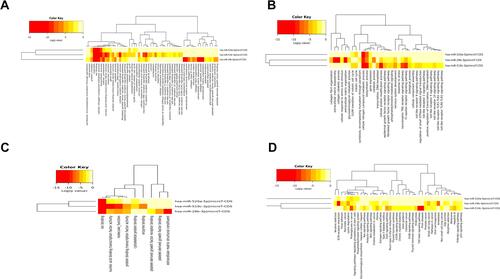
Figure 8 Regulatory networks of the key miRNAs, target genes and transcription factors. Network of hsa-miR-29b-3p and four transcription factors (A); network of hsa-miR-519c-3p and three transcription factors (B); network of hsa-miR-520a-5p and three transcription factors (C). Green octagons indicate transcription factors. Purple circles indicate target genes regulated by hub DEMs and transcription factors, and blue circles indicate target genes regulated by hub DEMs.
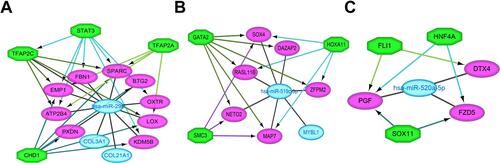
Figure 9 The expression of hsa-miR-29b-3, hsa-miR-519c-3p and hsa-miR-520a-5p in the comparison between the choriocarcinoma cell group and HRT-8 group. *p < 0.05 compared with HRT-8 group.
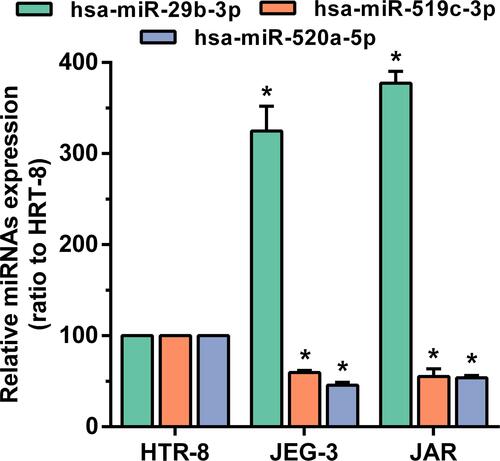
Figure 10 The effect of overexpression or silencing of hsa-miR-29b-3p, hsa-miR-519c-3p and hsa-miR-520a-5p on cell proliferation in JEG-3 and JAR cells. Viability of JEG-3 and JAR cells transfected with hub DEM mimics or inhibitors measured by CCK-8 (A–D) and EdU assays (E and F). The percentage of Edu positive JEG-3 and JAR. Proliferation ratio is assessed using EdU staining/Hoechst 33,342 (G and H). *p < 0.05 compared with NC-mimics in JEG-3 and JAR cells. **p < 0.05 compared with NC-inhibitor in JEG-3 and JAR cells.
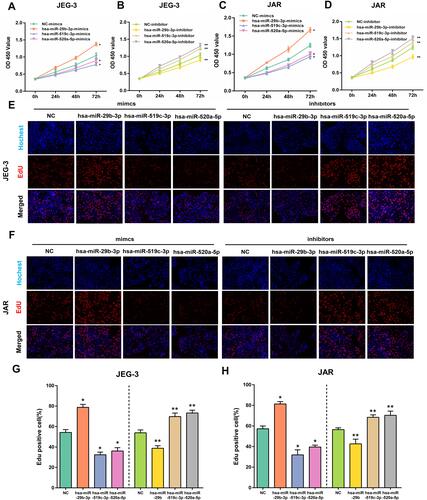
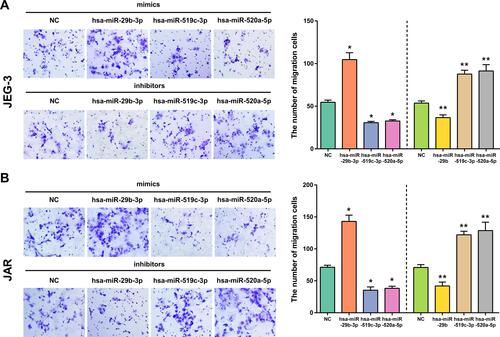
Figure 11 The effect of overexpression or silencing of hsa-miR-29b-3p, hsa-miR-519c-3p and hsa-miR-520a-5p on cell migration in JEG-3 (A) and JAR (B) cells. Cell migration was measured by Transwell assays. *p < 0.05 compared with NC-mimics in JEG-3 and JAR cells. **p < 0.05 compared with NC-inhibitor in JEG-3 and JAR cells.