Figures & data
Table 1 The Primer Sequences for Real-Time PCR
Figure 1 (A) Representative photos of CD44+ and ESA+ cells confirmed by visual examination under fluorescent microscope. Flow cytometry analysis of CD44+/ESA+ (CSCs) and CD44-/ESA- cells (non-CSCs) sorted from PANC1 and PK45 cells with immunofluorescence conjugated antibodies by the FACSAria cell sorter. (B) Colony formation ability of CSCs and non-CSCs delivered from PANC1 and PK45 cells. (C) Spheroid formation ability of CSCs and non-CSCs delivered from PANC1 and PK45 cells.
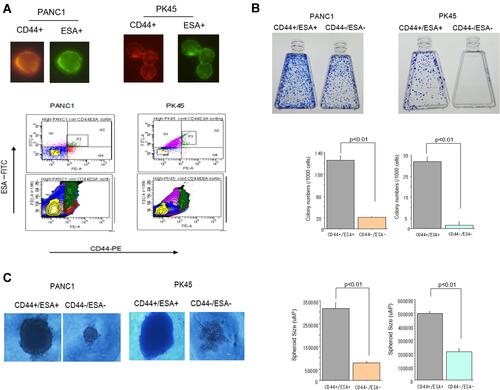
Figure 2 (A) Morphological changes of CSCs and non-CSCs delivered from PK45 cells 72 h after treatment with carbon-ion beam irradiation alone, X-ray irradiation alone or in combination with the miR-200c mimic. (B) Colony formation of CSCs and non-CSCs delivered from PK45 cells after treatment with carbon-ion beam, X-ray irradiation alone or in combination with the miR-200c mimic. *p< 0.01 compared to the control.
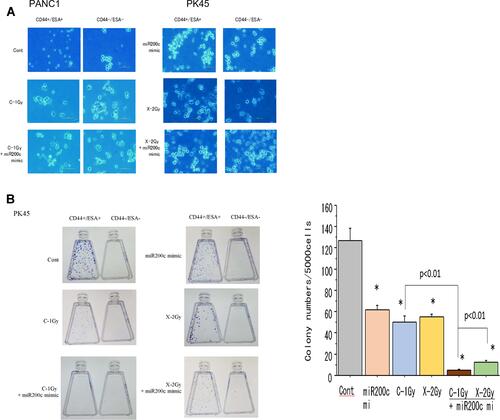
Figure 3 Spheroid formation of CSCs and non-CSCs delivered from PANC1 and PK45 cells after treatment with carbon-ion beam irradiation alone or in combination with the miR-200c mimic. #p<0.05, *p< 0.01 compared to the control.
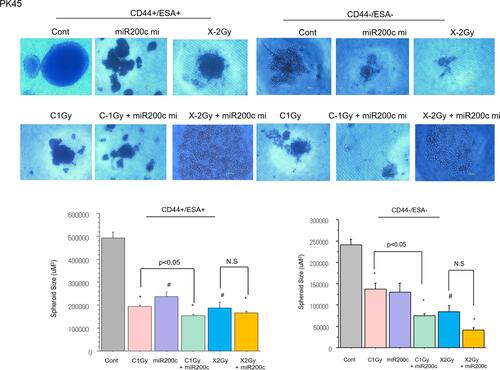
Figure 4 Cell viability of non-CSCs and CSCs delivered from PK45 cells after treatment with carbon-ion beam irradiation alone or in combination with the miR-200c mimic. *p< 0.01 compared to the control.
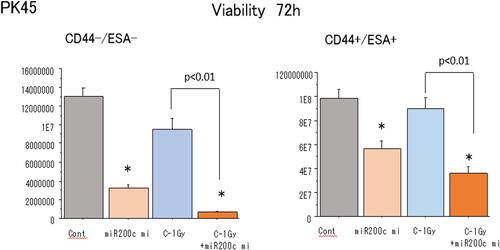
Figure 5 (A) Changes in the expression of apoptosis-related genes 96 h after treatment with carbon-ion beam irradiation alone or in combination with the miR-200c mimic and/or gemcitabine in CSCs and non-CSCs delivered from PK45 cells. (B) Changes in the expression of autophagy-related genes 96 h after treatment with carbon-ion irradiation alone or in combination with the miR-200c mimic and/or gemcitabine in CSCs and non-CSCs delivered from PK45 cells. (C) Expression changes of angiogenesis-related genes 96 h after treatment with carbon-ion irradiation alone or in combination with the miR-200c mimic and/or gemcitabine in CSCs and non-CSCs delivered from PK45 cells. *p< 0.01 compared to the control.
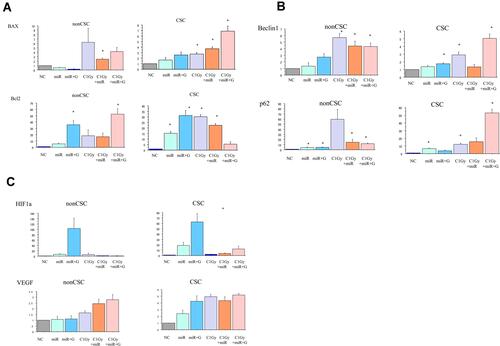
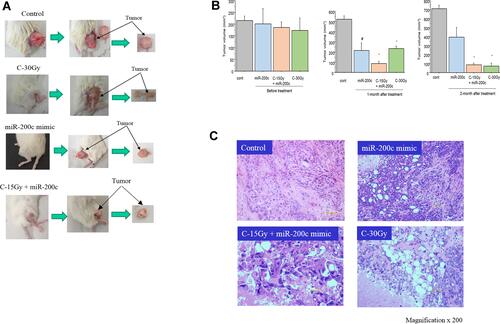
Figure 6 (A) Morphological changes of PK45 xenograft tumor after 30 Gy of carbon ion beam irradiation alone, miR-200c mimic alone or 15 Gy of carbon ion beam irradiation in combination with the miR-200c mimic. (B) Regression of PK45 xenograft tumor before and after treatment with 30 Gy of carbon ion beam irradiation alone, miR-200c mimic alone or 15 Gy of carbon ion beam irradiation in combination with the miR-200c mimic. #p<0.05, *p< 0.01 compared to the Control. (C) Histopathological changes in the PK45 xenograft tumor after 30 Gy of carbon ion beam irradiation alone, miR-200c mimic alone or 15 Gy of carbon ion beam irradiation in combination with the miR-200c mimic.