Figures & data
Figure 1 Sagittal CT scan representative image demonstrating the tumor's proximity to central arterial vasculature (A). Axial and coronal representative CT images demonstrating tumor proximity to gastric (B and D) and colonic (C) tissues (arrows demarcate points of organ abutment). Representative CT images obtained after 25 Gy of radiotherapy and four cycles of immunotherapy with gold fiducials demarcating the tumor (E–G).
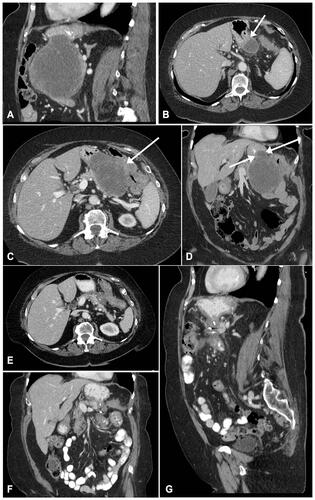
Figure 2 Pancreas with treatment effect. H&E stain (A and C) shows areas of necrosis surrounded by lymphocytes consistent with prior tumor bed. CD3 immunohistochemical stain (B and D) highlights CD3+ T lymphocytes surrounding areas of prior tumor bed.
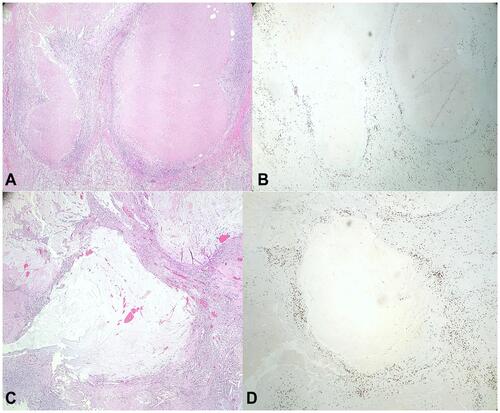
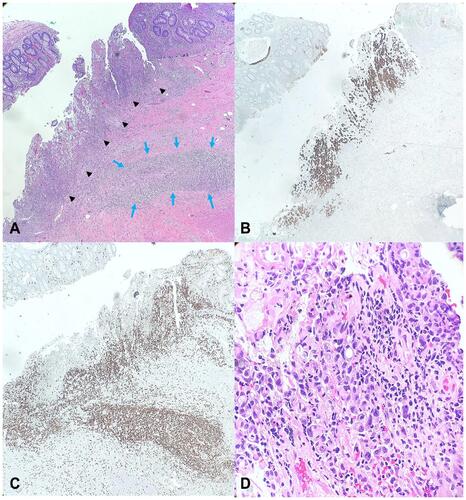
Figure 3 (A) H&E stain; 4x; Colon containing residual carcinoma with lymphocytic infiltrate within tumor (black arrowheads) and area of treatment effect (blue arrows). (B) CK7 IHC stain; 40x; CK7 stain highlighting residual carcinoma within colonic mucosa. (C) CD3 IHC stain; 40x; IHC stain highlighting CD3+ lymphocytes within tumor and area of treatment effect. (D) H&E stain; 400x; High power view of residual carcinoma within the colon with numerous tumor infiltrating lymphocytes.