Figures & data
Figure 1 MM cells with higher ROS levels are vulnerable to chidamide (CHI) -mediated cytotoxicity. (A) cells were treated with chidamide for 48 hours at indicated concentrations, the growth inhibition IC50 values of six MM cell lines were examined using CCK-8 assays. (B) basal ROS levels in the six MM cell lines, using Reactive Oxygen Species Assay Kit. (C) Pearson correlation analysis for IC50 values and relative ROS levels in the six MM cell lines. Each dot indicates mean value of IC50 values (corresponding to X-axis) and relative ROS levels (corresponding to Y-axis) of one MM cell line. (D and E) ARP-1 and RPMI-8226 cells were pretreated with or without 15 mmol/L NAC and then treated with different doses of chidamide, and cell viabilities were evaluated using CCK-8 assays. (F and G) ROS levels were measured after treatment with different doses of chidamide (0, 0.5 and 2 μM) for indicated time (0, 3, 6 and 12 hours), pretreated with or without 15 mmol/L NAC, in ARP-1 and RPMI-8226 cells. NS, p > 0.05; *, p < 0.05; **, p < 0.01; ***, p < 0.001.
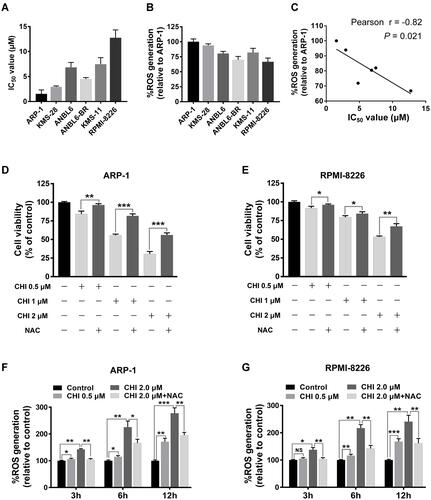
Figure 2 Chidamide (CHI) induces ROS production via SLC7A11 suppression and GSH reduction in MM cells. (A and B) GSH levels were measured using GSH and GSSG Assay Kit after chidamide treatment for 24 hours in ARP-1 and RPMI-8226 cells. (C and D) changes of SLC7A11 mRNA levels with different doses of chidamide treatment for 24 hours in ARP-1 and RPMI-8226 cells. (E-H) changes of SLC7A11/xCT protein levels with different doses of chidamide treatment for 24 hours in ARP-1 and RPMI-8226 cells using Western blotting and immunofluorescence analysis. Scale bars represent 20 μm. *, p < 0.05; **, p < 0.01; ***, p < 0.001 vs control.
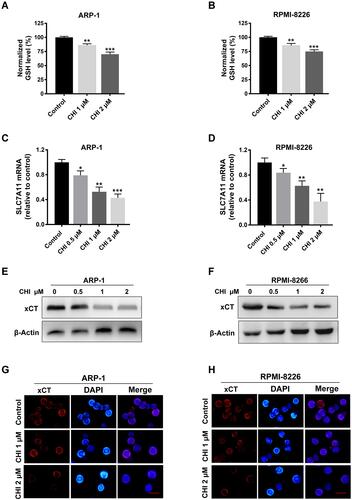
Figure 3 Chidamide (CHI) synergies with lenalidomide (Len) in inhibiting the proliferation of MM cells. (A and B) ARP-1 and RPMI-8226 cells were treated with chidamide combined with lenalidomide in different doses (1: 1 ratio of the two drugs) combinations for 48 hours, and the cell viability was analyzed using CCK-8 assay. (C and D) combination index (CI) values were calculated with the CompuSyn software. CI < 1 indicates synergy; CI = 1 is additive; and CI > 1 means antagonism. (E and F) ARP-1 or RPMI-8226 cells were treated with 1 μM chidamide and/ or 4 μM lenalidomide for 24 hours, inhibition rate were determined by CCK-8. (G and H) colony forming assay studies of colony formation rate of ARP1 and RPMI-8226 cells pretreated with 1 μM chidamide and/ or 4 μM lenalidomide for 24 hours and incubated for 10 days in solidified agar. NS, p > 0.05; *, p < 0.05; **, p < 0.01; ***, p < 0.001 vs combination.
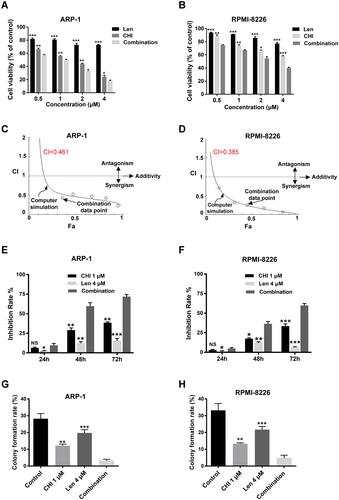
Figure 4 Chidamide (CHI) promotes apoptosis induction of lenalidomide (Len) in MM cells. (A and B) Annexin V-FITC/PI double staining analysis of ARP1 and RPMI-8226 cells treated with 1 μM chidamide and/ or 4 μM lenalidomide for 24 hours. Percentages of MM cell apoptosis based on three independent experiments. (C and D) MM cells derived from 3 MM patients were treated with 1 μM chidamide and/ or 4 μM lenalidomide in vitro for 24 hours, using flow cytometry for analysis. (E and F) expression of apoptosis biomarkers cleaved caspase-3, cleaved PARP were determined using Western blotting, β-actin as reference control. *, p < 0.05; **, p < 0.01 vs combination.
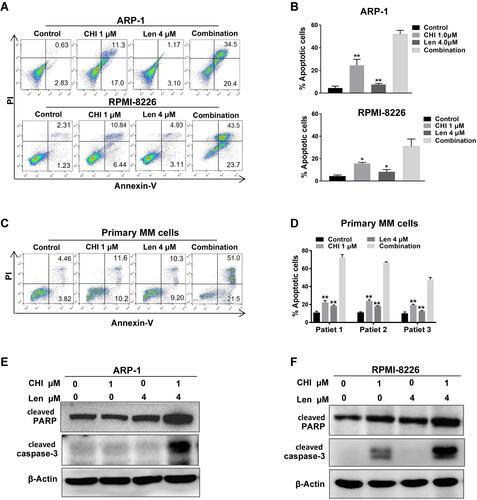
Figure 5 Chidamide (CHI)-induced ROS accumulation enhances anti-myeloma effect of lenalidomide (Len) through elevating H2O2. (A and B) ARP-1 and RPMI-8226 cells were treated with different doses of lenalidomide (0, 5 and 20 μM) for indicated time (0, 3, 6 and 12 hours), pretreated with or without 15 mmol/L NAC. Then ROS levels were measured using Reactive Oxygen Species Assay Kit. NS, p > 0.05; *, p < 0.05; **, p < 0.01. (C and D) ARP-1 and RPMI-8226 cells were treated with different doses of lenalidomide (0, 5 and 20 μM) for 12 hours, or 1 μM chidamide and 20 μM lenalidomide for 6 hours. Then H2O2 levels were tested using hydrogen peroxide assay kit. (E and F) after treated with 1 μM chidamide, 20 μM lenalidomide or H2O2 (100 and 500 μM) for 6 hours, expression of IKZF1 and IKZF3 were determined using Western blotting in ARP-1 and RPMI-8226 cells. (G and H) pretreated with or without 15 mmol/L NAC, ARP-1 and RPMI-8226 cells were then treated with 1 μM chidamide, 20 μM lenalidomide or 20 μM H2O2 for 24 hours, and CCK-8 assays were used to evaluate the cell viability. *, p < 0.05; **, p < 0.01; ***, p < 0.001.
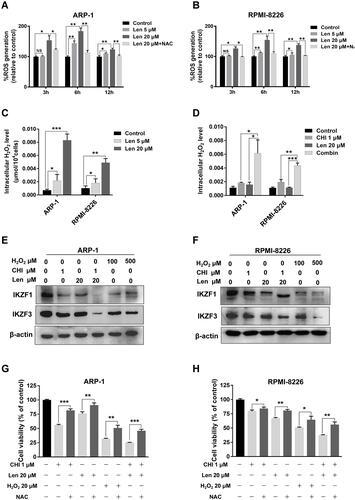
Figure 6 Combination of chidamide (CHI) and lenalidomide (Len) increase ROS-related DNA damage in MM cells. (A and B) DNA damage analysis by γ-H2AX foci immunofluorescence. Representative images of γ-H2AX (Red) and nuclei (Blue) in ARP-1 and RPMI-8226 cells treated with single agents or combination for 24 hours. Scale bars represent 20 μm. (C and D) after treated with 1 μM chidamide and/ or 4 μM lenalidomide for 24 hours, expression of γ-H2AX was determined using Western blotting.
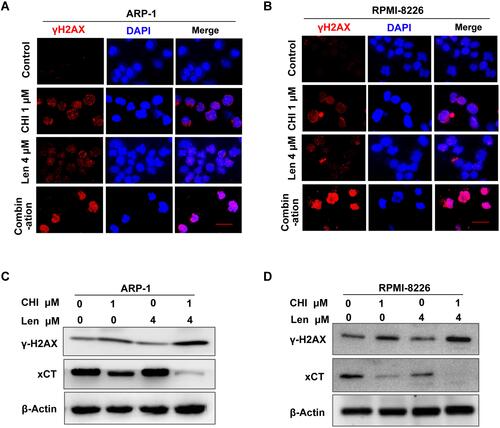
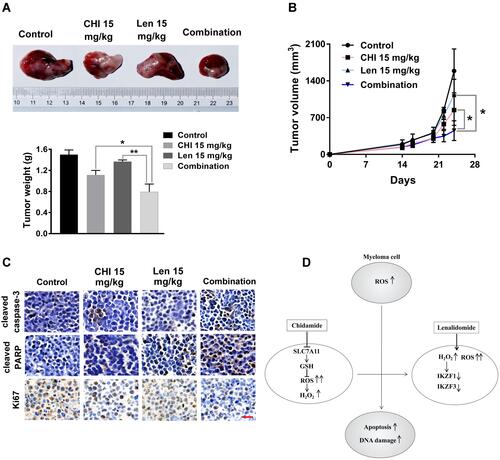
Figure 7 Chidamide (CHI) and lenalidomide (Len) exhibit synergistic anti-myeloma effect in vivo. (A and B) efficacy of single-agent and combination treatment of chidamide with lenalidomide in a human myeloma model in B-NDG mice. Tumor volumes and tumor weight of ARP-1 myelomas following treatment with single drugs and combined drugs (n=4). (C) immunohistochemical analyses with anti-cleaved caspase-3, anti-cleaved PARP, anti-Ki-67 induced by the treatment with single agents and combinations in vivo. Scale bars represent 50 μm. *, p < 0.05; **, p < 0.01. (D) The model of our working hypothesis.