Figures & data
Table 1 The Laboratory Findings
Figure 1 The changes of β2-MG, IL-6, VEGF, LDH. The series of β2-MG, IL-6 are drawn on the primary axis, and the series of VEGF, LDH are drawn on the secondary axis.
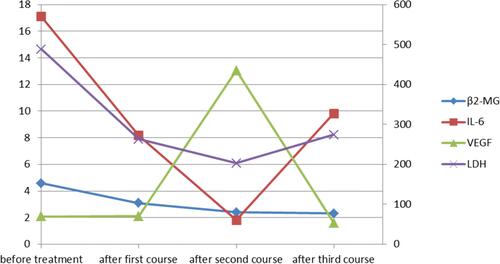
Figure 2 Flow cytometry of peripheral blood. (A–F) Before chemotherapy, the aberrant lymphocytes population expressed CD19, CD20, CD10, cKappa; (H–M) after three courses of chemotherapy, these became negative.
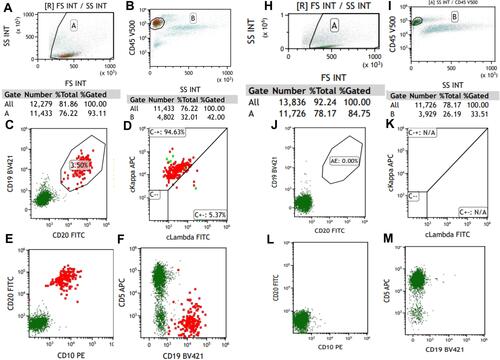
Figure 3 The immunostaining of right cervical lymph node for cytokines. (A) (b-FGF;×200), positive; (B) (IL-1β;×200), positive; (C) (IL-2;×200), positive; (D) (IL-6;×200), positive; (E) (IL-10,×200), positive; (F) (MUM-1×200), positive; (G) (PDGF×200), positive; (H) (TGF-β×200), positive; (I) (TNF-α×200), positive; (J) (VEGF×200), positive; (K) HE, ×40.
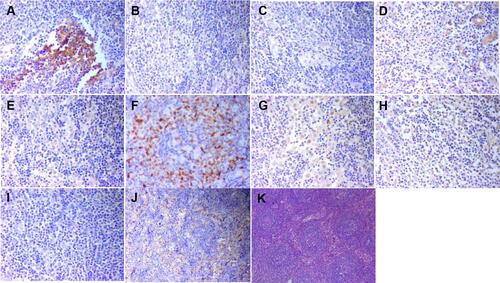
Figure 4 The immunostaining of bone marrow before treatment. (A) (b-FGF;×200), positive; (B) (CD20;×100), positive; (C) (CD61×100), positive; (D) (IL-10;×200), positive; (E) HE 100×; (F) (IL-1β;×200), positive; (G) (PDGF×200), positive; (H) (TGF-β×200), positive; (I) (VEGF×200), positive; (J) reticular fiber staining revealed diffuse fibrosis (MF-3) 100×; (K) (IL-2;×200), positive; (L) (IL-6;×200), positive; (M) (TNF-α×200), positive.
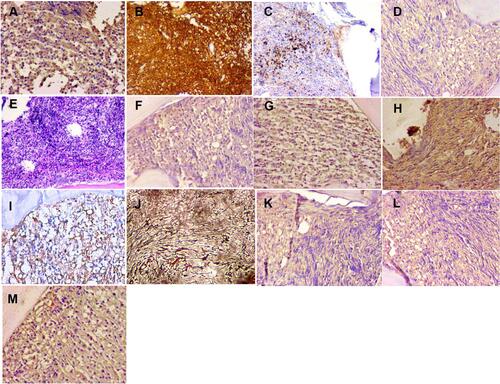
Figure 5 PET/CT finding. (A–C) Before chemotherapy. (The largest lymph nodes was in the lower abdominal mesenteric region 68mm x 42mm, SUVmax =8.2). (D–F) After three courses of chemotherapy (The spleen reduced obviously, whose metabolism was normal (SUVmax=2.6)). (A) Widespread lymph node enlargement and hypermetabolism, splenomegaly, kidney hypermetabolism (blue arrows) and diffuse bone marrow hypermetabolism. Its inferior border approached the upper margin of pelvis (SUVmax= 2.9); (B) spinal hypermetabolism (blue arrow); (SUVmax =9.0); (C) iliac hypermetabolism (blue arrows); (D) no abnormal lymph nodes were found. The volume of spleen was smaller than before, and the metabolism of bone marrow, kidney metabolism were normal (red arrows); (E) normal spine metabolism, (SUVmax =3.3) (red arrow); (F) normal ilium metabolism (red arrows).
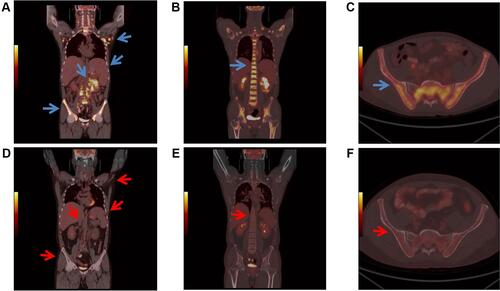
Figure 6 Fluorescence interphase in situ hybridization on lymph node biopsy. (A) IGH-BCL2 dual-colour dual-fusion probe displays two fused green and red signals, one isolated green and one isolated red signal in most of tumour nuclei with t(14;18) (q21;q32)/IGH-BCL2. Arrow indicates positive nuclei. (B) BCL2 dual-colour break-apart (BAP) probe shows one co-localised green and red signal, one isolated green and one isolated red signal in most of tumour nuclei; (C) BCL6 dual-colour break-apart (BAP) probe shows two co-localised green and red signal; (D) MYC dual-colour break-apart (BAP) probe shows one co-localised green and red signal.
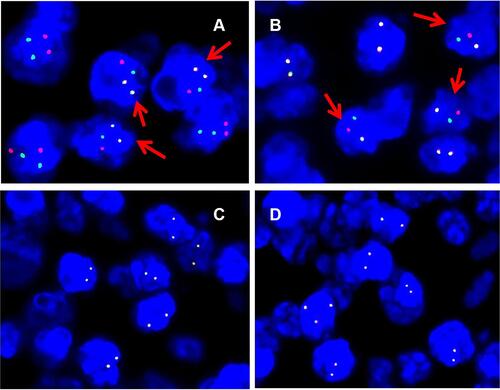
Table 2 The Analysis of Peripheral Blood
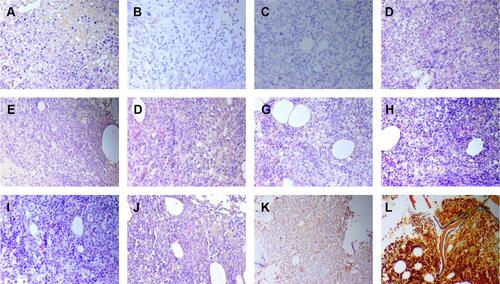
Figure 7 The immunostaining of bone marrow after one course of chemotherapy. (A) (b-FGF;×200), positive; (B) (CD19;×200), negative; (C) (CD117×200), negative; (D) (IL-1β;×200), positive; (E) (IL-2;×200), positive; (F) (IL-6;×200), positive; (G) (IL-10;×200), positive; (H) (PDGF×200), positive; (I) (TGF-β×200), positive; (J) (TNF-α×200), positive; (K) (VEGF×100), positive; (L) reticular fiber staining ×200, MF-1.
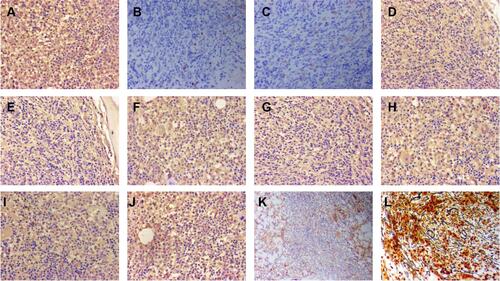
Figure 8 The immunostaining of bone marrow after two courses of chemotherapy. (A) (b-FGF;×200), negative; (B) (CD19;×200), negative; (C) (CD117;×200), negative; (D) (IL-1β;×200), negative; (E) (IL-2;×100), negative; (F) (IL-6;×200), negative; (G) (IL-10;×200), negative; (H) (PDGF×200), negative; (I) (TGF-β×200), negative; (J) (TNF-α×200), negative; (K) (VEGF×100), positive; (L) reticular fiber staining 100×, MF 0–1.