Figures & data
Figure 1 The expression of GSR in cervical cancers. (A) Full cervical cancer microarray examined by GSR IHC staining. (B–D) Representative GSR IHC staining in cervical adenocarcinomas. Nuclear and cytoplasmic positive staining (B), predominantly cytoplasmic positive staining (C), and predominantly nuclear positive staining (D). (E–G) Representative GSR IHC staining in squamous cell carcinomas. Negative staining (E), Nuclear and cytoplasmic positive staining (F and G). (H) Representative GSR IHC staining of cervicitis tissues. Weak positive staining in the cytoplasm. (I) IHC scores of cervical cancer of different grades. *P < 0.05 compared with nontumor tissues. (J) IHC scores of different cervical cancer types. *P < 0.05 compared with nontumor samples.
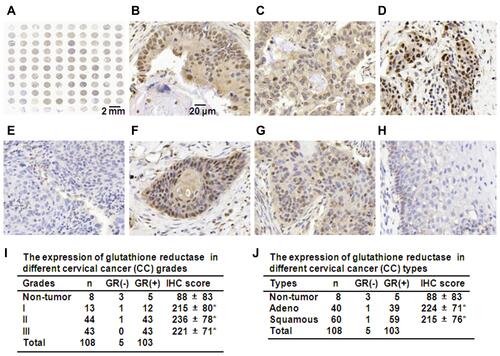
Figure 2 GSR RNA interference induces the death of cervical cancer cells. (A) FACS analysis of GSR protein expression in cervical cancer cells. (B) qRT-PCR analysis of GSR mRNA levels in cervical cancer cells. Tumor cells were treated with the indicated doses of GSR siRNA for 5 h and were then cultured for 48 h. *P < 0.05 compared with the control groups. (C) Western blot analysis of GSR protein levels in cervical cancer cells transfected with the indicated doses of GSR siRNA for 5 h and then cultured for 48 h. The GAPDH protein level was measured as the loading control. (D) PI/FITC-Annexin V staining of cervical cancer cells transfected with the indicated doses of GSR siRNA for 5 h and then cultured for 48 h. (E) Quantitative data from D. *P < 0.05 compared with the nonspecific siRNA (Ctrsi) groups.
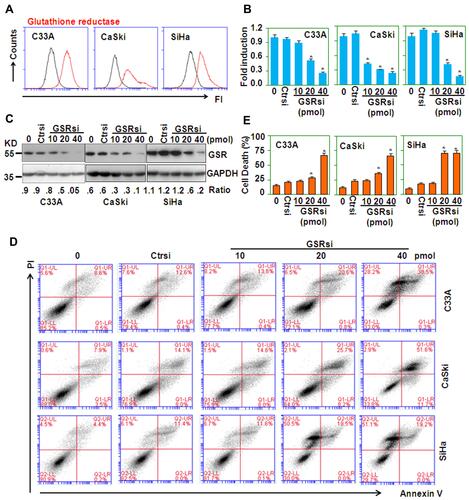
Figure 3 Stattic inhibits glutathione reductase activity and induces cell death. (A) Western blot analysis of the protein levels of GSR in cervical cancer cells treated with the indicated concentrations of Stattic for 24 h. The GAPDH protein level was measured as the loading control. (B) GSR activity in cervical cancer cells treated with the indicated concentrations of Stattic for 30 min. *P < 0.05 compared with the control groups. (C) GSR activity in cervical cancer cells treated with 20 µM Stattic for the indicated time periods. *P < 0.05 compared with the control groups. (D–G) PI/FITC-Annexin V staining of C33A (D), CaSki (E), SiHa (F), and HeLa (G) cells treated with the indicated concentrations of Stattic for 24 h. (H) Quantitative data from (D–G). *P < 0.05 compared with the medium groups.
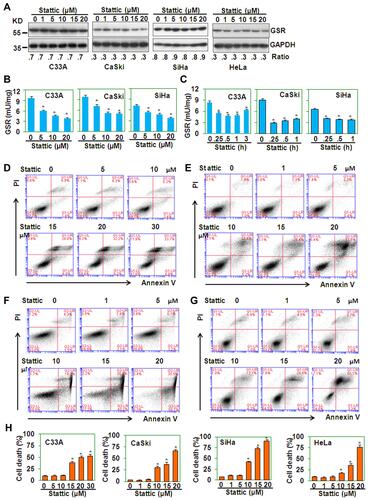
Figure 4 Stattic decreases tumor growth in nude mice. (A) Tumor growth curve for nude mice implanted with CaSki cells and treated with or without Stattic. *P < 0.05 compared with the vehicle groups. (B) Tumors from nude mice implanted with CaSki cells and treated with or without Stattic. (C) The weights of tumors from nude mice implanted with CaSki cells and treated with or without Stattic. *P < 0.05 compared with the vehicle group. (D) The weights of mice implanted with CaSki cells and treated with or without Stattic.
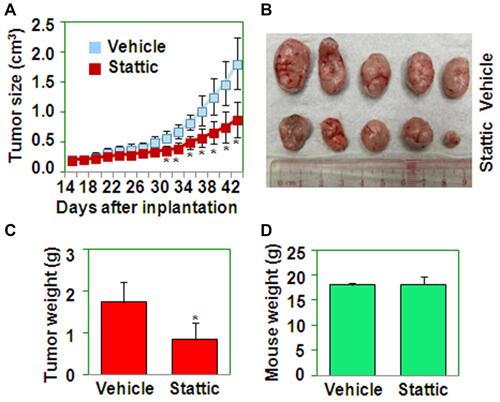
Figure 5 Caspases are not involved in Stattic-induced cell death. (A) Western blot analysis of the protein levels of caspase 3 in CaSki, SiHa, and C33A cells treated with the indicated concentrations of Stattic for 24 h. C33A cells treated with 5 μg/mL actinomycin D (Act D) were used as the positive control. The GAPDH protein level was measured as the loading control. (B and C) PI/FITC-Annexin V staining of C33A (B) and CaSki (C) cells pretreated with the indicated concentrations of Z-Vad-FMK (Z-vad, pan-Caspase inhibitor) for 1 h and retreated with 20 μM Stattic for 24 h. (D) The quantitative data from (B and C).
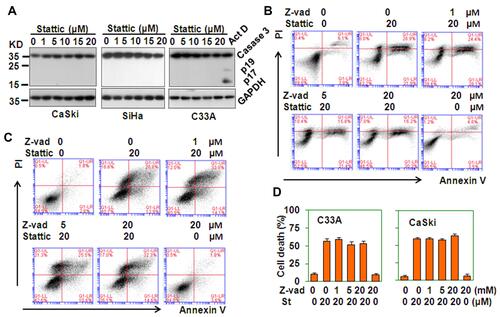
Figure 6 Stattic-induced cell death is ROS-dependent. (A) DCF staining of ROS levels in cervical cancer cells treated with the indicated concentrations of Stattic for the indicated time periods. (B–E) PI/FITC-Annexin V staining of C33A cervical cancer cells pretreated with the indicated concentrations of NAC (B) or GSH (C) for 1 h and of CaSki cervical cancer cells pretreated with the indicated concentrations of NAC (D) or GSH (E) for 1 h and retreated with 20 µM Stattic for 24 h. (F) The quantitative data from (B–E).
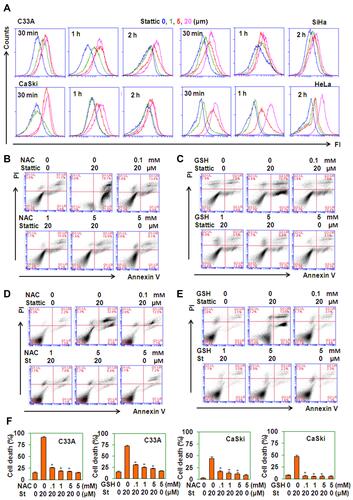
Figure 7 Stattic-induced cell death is STAT3-independent. (A) Western blot analysis of phosphorylated STAT3 in CaSki and SiHa cells treated with the indicated concentrations of Stattic or niclosamide for 8 h. The GAPDH protein level was measured as the loading control. (B and C) PI/FITC-Annexin V staining of CaSki (B) and SiHa (C) cells treated with the indicated concentrations of niclosamide (Ni) for 24 h. (D) The quantitative data from (B and C). (E) Western blot analysis of STAT3 protein levels in mock- and STAT3 CRISPR/Cas9-transfected C33A, CaSki, and SiHa cells. (F) PI/FITC-Annexin V staining of cervical cancer cells with STAT3 deletion. (G) The quantitative data from (F).
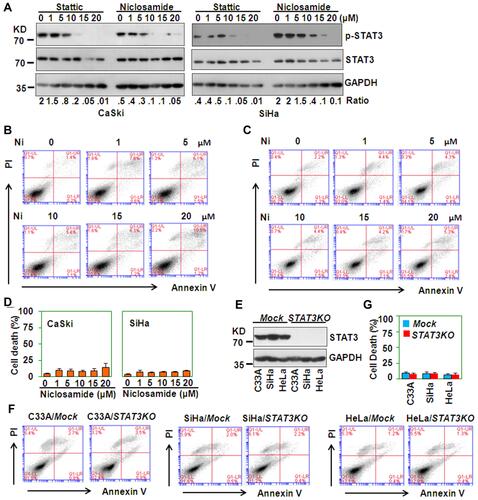
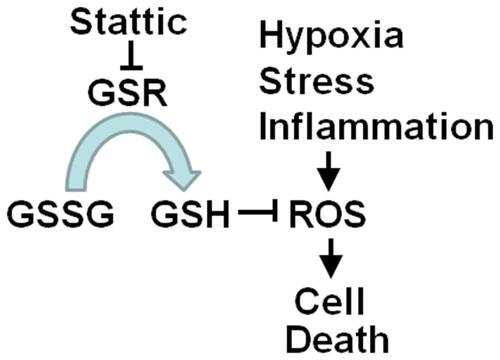
Figure 8 Model of the pathway by which Stattic induces ROS-dependent cell death. Stattic inhibits the enzymatic activity of GSR, resulting in a decrease in GSH, leading to accumulation of ROS and finally eliciting cell death.