
Figures & data
Figure 1 The specific operation process of extracellular vesicles extraction.
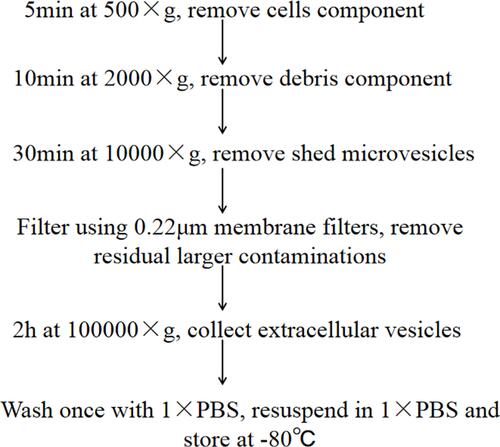
Table 1 The Basic Informations of tRNAs in Quantitative Real-Time PCR
Figure 2 Identification of extracellular vesicles in hypopharyngeal cancer patients and healthy subjects. (A and B) SEM of extracellular vesicles (200nm) in healthy subjects and hypopharyngeal cancer patients, respectively. (C and D) SEM of extracellular vesicles (500nm) in healthy subjects and hypopharyngeal cancer patients, respectively.
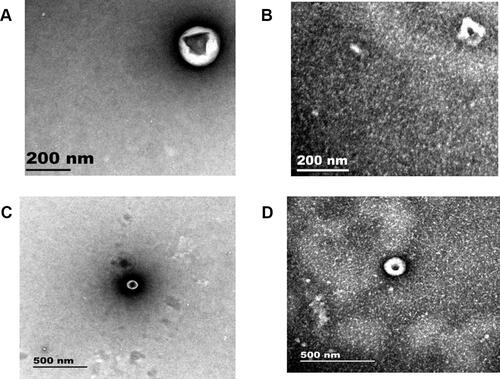
Table 2 The Primer Sequence of tRNAs in Quantitative Real-Time PCR
Figure 3 Sequencing of tRFs. (A) Heat map analysis of tRFs, with 5 samples chosen from groups N and NT, respectively, for sequencing. N is the control group (healthy subjects), and NT is the experimental group (treatment-naive and non-lung metastatic hypopharyngeal cancer patients). (B) Expressions of tRF-1:30-Lys-CTT-1-M2, tRF-1:30-Lys-CTT-2-M2 and tRF-60:76-Lys-CTT-1-M4 in the human normal laryngeal epithelial cell and hypopharyngeal cancer cell (FaDu), respectively. ***Means that compared with human normal laryngeal epithelial cellS, the expression of tRF-1:30-Lys-CTT-1-M2 in FaDu cells is significantly increased, and the difference is statistically significant.
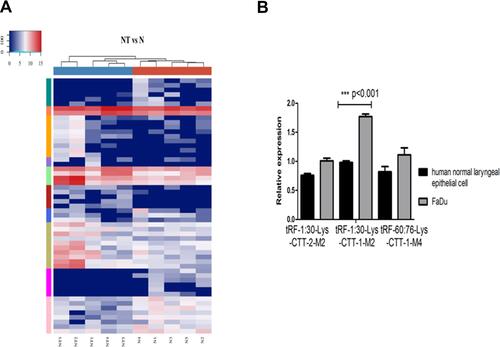
Figure 4 Subtype analysis of tRFs. (A and B) Subtype analysis of extracellular vesicles tRFs in the healthy subjects and hypopharyngeal cancer patients, respectively. (C and D) The length distribution of each tRFs subtype in healthy individuals and hypopharyngeal cancer patients, respectively. N is the control group (healthy subjects), and NT is the experimental group (treatment-naive and non-lung metastatic hypopharyngeal cancer patients).

Figure 5 Expressions of tRFs in the treatment-naive and non-lung metastatic hypopharyngeal cancer patients. (A–C) Extracellular vesicles expressions of tRF-1:30-Lys-CTT-1-M2, tRF-1:30-Lys-CTT-2-M2, and tRF-60:76-Lys-CTT-1-M4 in the treatment-naive and non-lung metastatic hypopharyngeal cancer patients and healthy subjects, respectively. ***Means that compared with healthy subjects, the expression of tRF-1:30-Lys-CTT-1-M2 in newly diagnosed patients is significantly increased, and the difference is statistically significant.
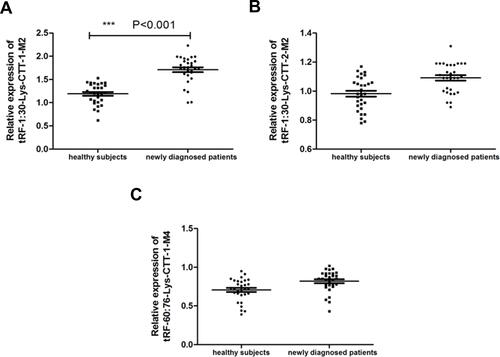
Table 3 Correlation Analysis Between the Expression Level of tRNA Fragment and Its Clinicopathological Characteristics in 30 Newly Diagnosed and Newly Treated HNC Patients
Table 4 The Relationship Between the Expression Level of tRNA Fragments and the Clinicopathological Characteristics of 30 Patients with HNC Lung Metastasis
Figure 6 Analysis of the diagnostic value of tRFs. (A–C) ROC curve analysis of tRF-1:30-Lys-CTT-1-M2, tRF-1:30-Lys-CTT-2-M2, and tRF-60:76-Lys-CTT-1-M4 in hypopharyngeal cancer patients, respectively. (D) Expressions of tRF-1:30-Lys-CTT-1-M2 in the lung metastatic and non-lung metastatic patients. ***Means that compared with metastatic patients, the expression of tRF-1:30-Lys-CTT-1-M2 in newly diagnosed patients is significantly decreased, and the difference is statistically significant.
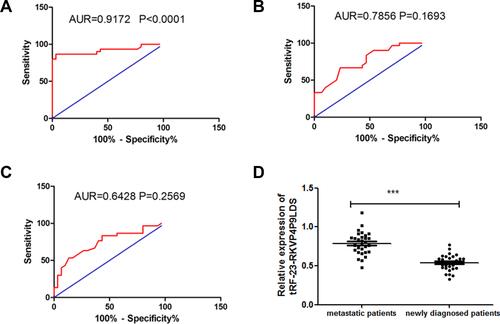
Table 5 Univariate and Multivariate Cox Regression Analysis of Risk Factors for Patients with HNC Metastasis