Figures & data
Figure 1 PRISMA flow diagram of included studies.
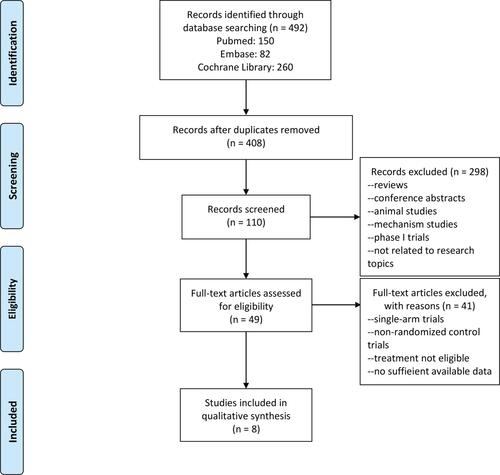
Table 1 Basic Characteristics of the 8 Trials Included in the Meta-Analysis
Figure 2 Risk of bias graph (A) and risk of bias summary (B) for all included trials.
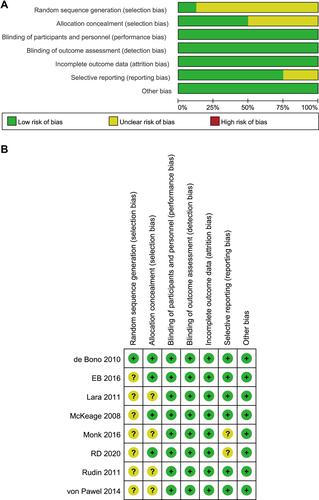
Figure 3 Forest plot diagram of the objective response rate. (A) Forest plot diagram analysed using random-effects model. (B) Forest plot diagram analysed using fixed-effects model.
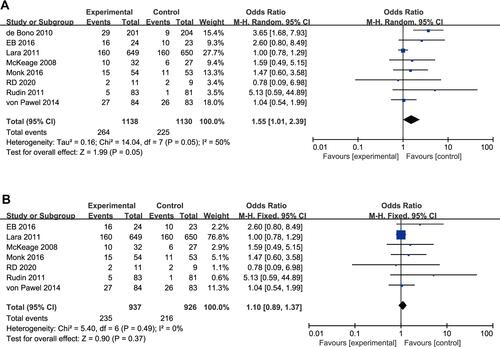
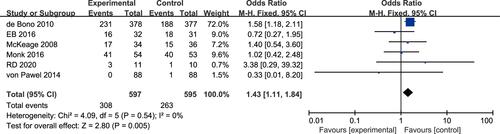
Figure 4 Forest plot diagram of the disease control rate.
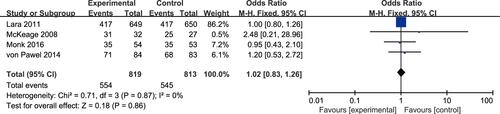
Figure 5 Forest plot diagram of the 6-month progression-free survival rate.
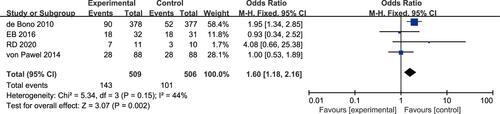
Figure 6 Forest plot diagram of the 12-month progression-free survival rate.
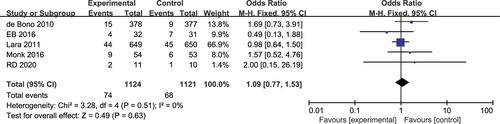
Figure 7 Forest plot diagram of the 0.5‑year survival rate.(A) Forest plot diagram analysed using random-effects model. (B) Forest plot diagram analysed using fixed-effects model.
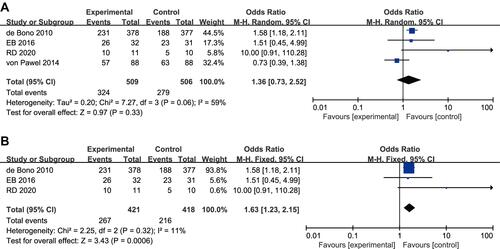
Figure 8 Forest plot diagram of the 1‑year survival rate.